Exam 18: Statistical Quality Control
Exam 1: Introduction to Statistics94 Questions
Exam 2: Charts and Graphs92 Questions
Exam 3: Descriptive Statistics81 Questions
Exam 4: Probability87 Questions
Exam 5: Discrete Distributions88 Questions
Exam 6: Continuous Distributions90 Questions
Exam 7: Sampling and Sampling Distributions93 Questions
Exam 8: Statistical Inference: Estimation for Single Populations88 Questions
Exam 9: Statistical Inference: Hypothesis Testing for Single Populations101 Questions
Exam 10: Statistical Inferences About Two Populations98 Questions
Exam 11: A Nalysis of Variance and Design of Experiments106 Questions
Exam 12: Simple Regression Analysis and Correlation106 Questions
Exam 13: Multiple Regression Analysis93 Questions
Exam 14: Building Multiple Regression Models95 Questions
Exam 15: Time-Series Forecasting and Index Numbers94 Questions
Exam 16: Analysis of Categorical Data85 Questions
Exam 17: Nonparametric Statistics99 Questions
Exam 18: Statistical Quality Control86 Questions
Exam 19: Decision Analysis91 Questions
Select questions type
Sarah Soliz,Director of Quality Programs,is designing  and R charts for the rod shearing process at Stockton Steel.She has 26 samples of rod length,and each sample included measurements of 5 rods.The mean of the 26 sample means is 112 inches,and mean of the 26 ranges is 0.15 inch.The upper control limit for her R chart is ____.
(Multiple Choice)
4.7/5  (36)
(36)
Higher output wattage means higher quality to some consumers of audio amplifiers.Among Garvin's five quality types,this is an example of ______________.
(Multiple Choice)
4.9/5 (42)
An  chart is being developed using 15 samples of size 9 each.The average of 15 sample means is 6.20.The average of the 15 ranges is 0.30.The lower control limit is _______________.
(Multiple Choice)
4.8/5 (36)
Nels Neugent,Purchasing Manager at Mid-West Medical Center,is designing a p chart to monitor the proportion of defective purchase orders issued at Mid-West. He has the proportions defective for 22 samples of purchase orders. Each sample contains 150 purchase orders,and the average proportion defective is 0.08. The upper control limit for Nels's p chart is ___________.
(Multiple Choice)
5.0/5 (40)
A Pareto chart is a diagnostic tool that displays possible causes of a quality problem and the interrelationships among the causes.
(True/False)
4.8/5 (31)
Failure Mode Effect Analysis is best described as _________.
(Multiple Choice)
4.8/5 (35)
According to the following Pareto chart,the most common complaint was ______. 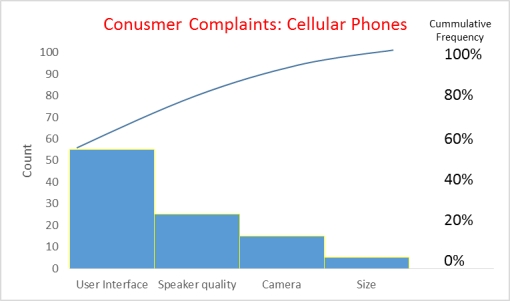
(Multiple Choice)
4.9/5 (31)
Which of the following wastes lean manufacturing doesn't focus on?
(Multiple Choice)
4.8/5 (35)
For a p chart,UCL = 0.64 and LCL = 0.32.Then the overall percentage of compliant items is ______%.
(Multiple Choice)
4.8/5 (35)
Quality control can be undertaken in two distinct ways: after-process control and before-process control.
(True/False)
4.9/5 (35)
Jack Joyner,Director of Quality Control at Covington Castings (CC),is designing a c chart to monitor the number of nonconformances per aluminum casting produced at CC. The total number of nonconformances for 26 castings is 91.The upper control limit for Jack's c chart is ___________.
(Multiple Choice)
4.9/5 (33)
You are conducting a study on the blood glucose levels of 9 patients who are on strict diets and exercise routines.To monitor the mean and range of the blood glucose levels of your patients,you take a blood glucose reading every day for each patient for 20 days.The results are shown below.  The lower control limit for your
  chart is ________.
(Multiple Choice)
4.8/5 (33)
A recognized brand name product means higher quality to many consumers.Among Garvin's five quality types,this is an example of ___________________.
(Multiple Choice)
4.9/5 (30)
Which of the following quality control chart conditions is an indicator that the process is potentially out-of-control?
(Multiple Choice)
4.9/5 (24)
Jake Flanaghan,Vice President for inpatient pharmacy,at Great Atlantic Medical Center,is designing a c chart to monitor the number of inpatient medication errors that occur each month. The total number of medication errors for January - December last year was 37. The upper control limit for Jake's c chart is ___________.
(Multiple Choice)
4.7/5 (32)
Jack Joyner,Director of Quality Control at Covington Castings (CC),is designing a c chart to monitor the number of nonconformances per aluminum casting produced at CC. The total number of nonconformances for 26 castings is 91. The centerline for Jack's c chart is ___________.
(Multiple Choice)
4.9/5 (38)
Filters
- Essay(0)
- Multiple Choice(0)
- Short Answer(0)
- True False(0)
- Matching(0)