Exam 18: Statistical Quality Control
Exam 1: Introduction to Statistics94 Questions
Exam 2: Charts and Graphs92 Questions
Exam 3: Descriptive Statistics81 Questions
Exam 4: Probability87 Questions
Exam 5: Discrete Distributions88 Questions
Exam 6: Continuous Distributions90 Questions
Exam 7: Sampling and Sampling Distributions93 Questions
Exam 8: Statistical Inference: Estimation for Single Populations88 Questions
Exam 9: Statistical Inference: Hypothesis Testing for Single Populations101 Questions
Exam 10: Statistical Inferences About Two Populations98 Questions
Exam 11: A Nalysis of Variance and Design of Experiments106 Questions
Exam 12: Simple Regression Analysis and Correlation106 Questions
Exam 13: Multiple Regression Analysis93 Questions
Exam 14: Building Multiple Regression Models95 Questions
Exam 15: Time-Series Forecasting and Index Numbers94 Questions
Exam 16: Analysis of Categorical Data85 Questions
Exam 17: Nonparametric Statistics99 Questions
Exam 18: Statistical Quality Control86 Questions
Exam 19: Decision Analysis91 Questions
Select questions type
You are conducting a study on the blood glucose levels of 9 patients who are on strict diets and exercise routines.To monitor the mean and range of the blood glucose levels of your patients,you take a blood glucose reading every day for each patient for 20 days.The results are shown below.  The centerline for your
  chart is _________.
(Multiple Choice)
4.8/5  (33)
(33)
Which of the following statements best describes Design for Six Sigma?
(Multiple Choice)
4.9/5 (38)
Ophelia O'Brien,VP of Consumer Credit of American First Banks (AFB),is designing a p chart to monitor the default rate on personal loans at the AFB member banks. Her data includes the proportion in default for 30 samples of personal loans.Each sample contains 50 loans,and the average of the 30 proportions is 0.05.The lower control limit for Ophelia's p chart is _____________.
(Multiple Choice)
4.9/5 (39)
Control charts are used to examine the output of a process for disturbing patterns or for data points that indicate that the process is out of control.
(True/False)
4.8/5 (34)
Upper and lower control limits are usually based upon _______.
(Multiple Choice)
5.0/5 (32)
Nels Neugent,Purchasing Manager at Mid-West Medical Center,is designing a p chart to monitor the proportion of defective purchase orders issued at Mid-West. He has the proportions defective for 22 samples of purchase orders. Each sample contains 150 purchase orders,and the average proportion defective is 0.08. The lower control limit for Nels's p chart is ___________.
(Multiple Choice)
4.9/5 (36)
A company that uses benchmarking as a quality improvement practice will ________.
(Multiple Choice)
4.8/5 (28)
One definition that captures the spirit of most quality efforts in the business world is that quality results when a product delivers what is stipulated for it in its specifications.
(True/False)
4.8/5 (42)
A graph that plots the number of nonconformances per item for multiple samples is called a(n)_______.
(Multiple Choice)
4.8/5 (28)
According to Garvin,product quality is ____________________.
(Multiple Choice)
4.8/5 (28)
For a p chart,UCL = 0.64 and LCL = 0.32.The standard deviation of the proportions is ______.
(Multiple Choice)
4.9/5 (38)
You are conducting a study on the blood glucose levels of 9 patients who are on strict diets and exercise routines.To monitor the mean and range of the blood glucose levels of your patients,you take a blood glucose reading every day for each patient for 20 days.The mean of the 9 sample means is 101.03,and the mean of the 9 standard deviations is 29.243.The lower control limit for your  chart is ________.
(Multiple Choice)
4.7/5 (35)
Sarah Soliz,Director of Quality Programs,is designing  and R charts for the rod shearing process at Stockton Steel.She has 26 samples of rod length,and each sample included measurements of 5 rods.The mean of the 26 sample means is 112 inches,and mean of the 26 ranges is 0.15 inch.The centerline for her
  chart is _________.
(Multiple Choice)
4.8/5 (35)
A quality circle studying the problem of incorrect prices on purchase orders identified several potential causes: incorrect information from requesting department,out-of-date catalogs from suppliers,defective computer software,and worker practices in the purchasing department. These potential cause-and-effect relationships are best illustrated by a _______________.
(Multiple Choice)
4.8/5 (39)
According to the following Pareto chart,the Pareto principle would suggest a quality improvement team focus their efforts on which of the following complaints?
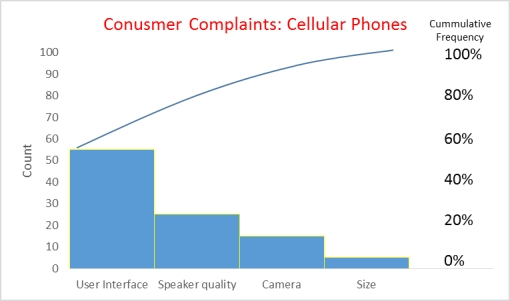
(Multiple Choice)
4.8/5 (32)
A p Chart is to be developed for use in quality control. The value of p is calculated to be 0.05.The sample size is 50.What would the upper control limit be?
(Multiple Choice)
4.9/5 (36)
Measuring product attributes at regular intervals throughout the manufacturing process in an effort to pinpoint problem areas is called in-process quality control.
(True/False)
4.8/5 (43)
A scatter diagram is a graphical mechanism for examining the relationship between two variables.
(True/False)
4.7/5 (34)
Ophelia O'Brien,VP of Consumer Credit of American First Banks (AFB),is designing a p chart to monitor the default rate on personal loans at the AFB member banks. Her data includes the proportion in default for 30 samples of personal loans.Each sample contains 50 loans,and the average of the 30 proportions is 0.05.The upper control limit for Ophelia's p chart is _____________.
(Multiple Choice)
4.8/5 (42)
Filters
- Essay(0)
- Multiple Choice(0)
- Short Answer(0)
- True False(0)
- Matching(0)