Exam 5: Elasticity of Demand and Supply
Exam 1: The Art and Science of Economic Analysis150 Questions
Exam 2: Economic Tools and Economic Systems159 Questions
Exam 3: Economic Decision Makers174 Questions
Exam 4: Demand, Supply, and Markets152 Questions
Exam 5: Elasticity of Demand and Supply149 Questions
Exam 6: Consumer Choice and Demand150 Questions
Exam 7: Production and Cost in the Firm151 Questions
Exam 8: Perfect Competition150 Questions
Exam 9: Monopoly150 Questions
Exam 10: Monopolistic Competition and Oligopoly150 Questions
Exam 11: Resource Markets150 Questions
Exam 12: Labor Markets and Labor Unions150 Questions
Exam 13: Capital, Interest, Entrepreneurship, and Corporate Finance150 Questions
Exam 14: Transaction Costs, Asymmetric Information, and Behavioral Economics152 Questions
Exam 15: Economic Regulation and Antitrust Policy150 Questions
Exam 16: Public Goods and Public Choice150 Questions
Exam 17: Externalities and the Environment150 Questions
Exam 18: Poverty and Redistribution150 Questions
Exam 19: International Trade150 Questions
Exam 20: International Finance150 Questions
Exam 21: Economic Development150 Questions
Select questions type
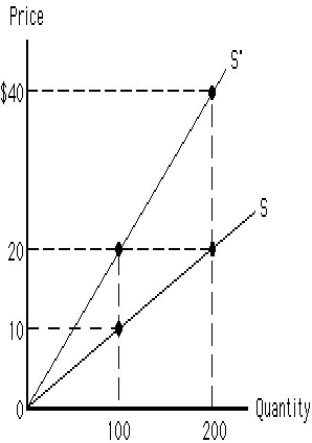
Figure 5.10 shows two upward-sloping linear supply curves that pass through the origin. Which supply curve is more elastic in the figure below? Figure 5.10
(Multiple Choice)
4.9/5  (25)
(25)
Price elasticity is 1 at the midpoint of a linear downward-sloping demand curve.
(True/False)
4.8/5 (35)
The price elasticity of demand is typically negative because:
(Multiple Choice)
4.7/5 (34)
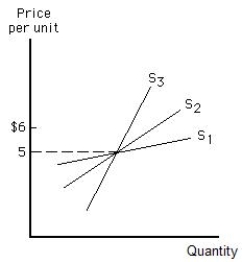
Figure 5.9 shows three upward-sloping linear supply curves. Which of the following supply curves is the most elastic and which is the least elastic between the prices of $5 and $6? Figure 5.9
(Multiple Choice)
4.8/5 (42)
Goods with an income elasticity of demand greater than 1 are called:
(Multiple Choice)
4.8/5 (46)
Which of the following determines a firm's revenue when it changes the price of its product?
(Multiple Choice)
4.8/5 (39)
If a price reduction leads to an increase in total revenue, demand is:
(Multiple Choice)
4.7/5 (35)
Which of the following describes a situation in which demand must be inelastic?
(Multiple Choice)
4.7/5 (32)
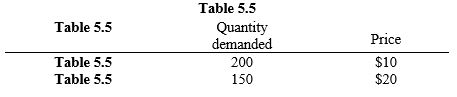
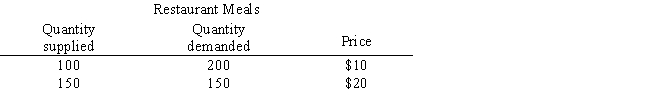
Table 5.5 shows the quantity supplied and the quantity demanded for restaurant meals at different prices. Use the information in the table below to calculate the price elasticity of supply for restaurant meals. Table 5.5
(Multiple Choice)
5.0/5 (28)
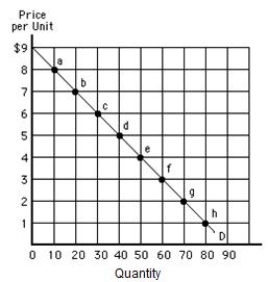
Figure 5.4 shows a downward-sloping linear demand curve. Which of the following is true between points g and h in the figure below?
Figure 5.4
(Multiple Choice)
4.8/5 (34)
For which of the following is demand most likely to be perfectly inelastic?
(Multiple Choice)
4.8/5 (34)
If a 5 percent increase in price leads to an 8 percent decrease in quantity demanded, demand is:
(Multiple Choice)
4.9/5 (40)
Table 5.3 shows the quantity supplied and the quantity demanded for restaurant meals at different prices. Use the information in the table below to calculate the value of the price elasticity of demand for restaurant meals. Table 5.3
(Multiple Choice)
4.7/5 (35)
The cross-price elasticity of demand is used to determine whether:
(Multiple Choice)
4.9/5 (42)
Which of the following does not determine a good's price elasticity of demand?
(Multiple Choice)
4.8/5 (32)
If an increase in price from $1.20 to $2 per unit leads to an increase in quantity supplied from 20 to 100 units, then:
(Multiple Choice)
4.8/5 (38)
Given the proportion of a consumer's income spent on various goods, the demand for _____ is likely to be the most price inelastic.
(Multiple Choice)
4.8/5 (32)
Filters
- Essay(0)
- Multiple Choice(0)
- Short Answer(0)
- True False(0)
- Matching(0)