Exam 5: Elasticity of Demand and Supply
Exam 1: The Art and Science of Economic Analysis150 Questions
Exam 2: Economic Tools and Economic Systems159 Questions
Exam 3: Economic Decision Makers174 Questions
Exam 4: Demand, Supply, and Markets152 Questions
Exam 5: Elasticity of Demand and Supply149 Questions
Exam 6: Consumer Choice and Demand150 Questions
Exam 7: Production and Cost in the Firm151 Questions
Exam 8: Perfect Competition150 Questions
Exam 9: Monopoly150 Questions
Exam 10: Monopolistic Competition and Oligopoly150 Questions
Exam 11: Resource Markets150 Questions
Exam 12: Labor Markets and Labor Unions150 Questions
Exam 13: Capital, Interest, Entrepreneurship, and Corporate Finance150 Questions
Exam 14: Transaction Costs, Asymmetric Information, and Behavioral Economics152 Questions
Exam 15: Economic Regulation and Antitrust Policy150 Questions
Exam 16: Public Goods and Public Choice150 Questions
Exam 17: Externalities and the Environment150 Questions
Exam 18: Poverty and Redistribution150 Questions
Exam 19: International Trade150 Questions
Exam 20: International Finance150 Questions
Exam 21: Economic Development150 Questions
Select questions type
Table 5.2 shows the change in the quantity demanded for Good A and Good B as a result of the change in their price. Use the information in the table below to calculate the value of the price elasticity of demand for Good B. Table 5.2
Quantity
Price
Good A
100
$10
120
$ 9
Good B
200
$20
140
$35
(Multiple Choice)
4.8/5  (41)
(41)
As DVDs become popular substitutes for video cassettes, demand for video cassettes is likely to:
(Multiple Choice)
4.8/5 (36)
If city officials expect that an increase in bus fares will raise mass transit revenues, they must think that the demand for bus travel is _____.
(Multiple Choice)
4.9/5 (29)
Both the income elasticity of demand and the cross-price elasticity of demand coefficients can take on negative, zero, or positive values.
(True/False)
4.8/5 (39)
Figure 5.1 shows the demand curve for a firm. In the figure below, the total revenue at point a is _____. Figure 5.1
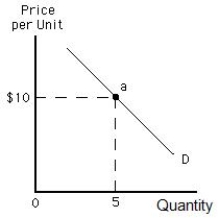
(Multiple Choice)
4.9/5 (39)
Total revenue is the same for every price-quantity combination along a unit-elastic demand curve.
(True/False)
4.8/5 (27)
The percentage change in the demand for film divided by the percentage change in the price of cameras indicates:
(Multiple Choice)
4.8/5 (35)
If the price of Pepsi-Cola increases from 50 cents to 60 cents per can and the quantity demanded decreases from 100 cans to 50 cans, then the demand for Pepsi-Cola is:
(Multiple Choice)
4.9/5 (34)
As consumers have a longer time period to respond, the demand for a product typically becomes more inelastic.
(True/False)
4.9/5 (40)
Figure 5.3 shows a linear demand curve. Between points C and D, the demand is:
Figure 5.3
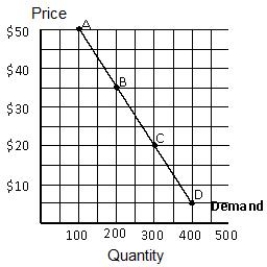
(Multiple Choice)
4.8/5 (35)
The greater the availability of close substitutes for a product, the greater the price elasticity of demand for that product.
(True/False)
4.8/5 (31)
Suppose the price elasticity of demand for your economics textbook is −1. If the publisher raises the price by 5 percent:
(Multiple Choice)
4.9/5 (38)
The price elasticity of demand for milk when quantity is measured in gallons will be _____ the price elasticity when quantity is measured in quarts.
(Multiple Choice)
4.8/5 (31)
The demand curve for a good that has many perfect substitutes is likely to be:
(Multiple Choice)
4.9/5 (47)
Table 5.2 shows the change in the quantity demanded for Good A and Good B as a result of the change in their price. Use the information in the table below to calculate the price elasticity of demand for Good A. Table 5.2
Quantity
Price
Good A
100
$10
120
$ 9
Good B
200
$20
140
$35
(Multiple Choice)
4.9/5 (33)
Filters
- Essay(0)
- Multiple Choice(0)
- Short Answer(0)
- True False(0)
- Matching(0)