Exam 17: Externalities and the Environment
Exam 1: The Art and Science of Economic Analysis150 Questions
Exam 2: Economic Tools and Economic Systems159 Questions
Exam 3: Economic Decision Makers174 Questions
Exam 4: Demand, Supply, and Markets152 Questions
Exam 5: Elasticity of Demand and Supply149 Questions
Exam 6: Consumer Choice and Demand150 Questions
Exam 7: Production and Cost in the Firm151 Questions
Exam 8: Perfect Competition150 Questions
Exam 9: Monopoly150 Questions
Exam 10: Monopolistic Competition and Oligopoly150 Questions
Exam 11: Resource Markets150 Questions
Exam 12: Labor Markets and Labor Unions150 Questions
Exam 13: Capital, Interest, Entrepreneurship, and Corporate Finance150 Questions
Exam 14: Transaction Costs, Asymmetric Information, and Behavioral Economics152 Questions
Exam 15: Economic Regulation and Antitrust Policy150 Questions
Exam 16: Public Goods and Public Choice150 Questions
Exam 17: Externalities and the Environment150 Questions
Exam 18: Poverty and Redistribution150 Questions
Exam 19: International Trade150 Questions
Exam 20: International Finance150 Questions
Exam 21: Economic Development150 Questions
Select questions type
Which of the following is an example of a positive externality?
Free
(Multiple Choice)
4.8/5  (36)
(36)
Correct Answer: Verified
B
The government passes a new law allowing only 1,000 tons of pollution per day to be generated and simultaneously sells 1,000 transferable rights to emit one ton each of pollution per day. Which of the following is true?
Free
(Multiple Choice)
4.9/5 (32)
Correct Answer:Verified
B
The Coase theorem argues that the assignment of property rights will generate an efficient solution to the problem of:
Free
(Multiple Choice)
4.8/5 (33)
Correct Answer:Verified
B
When consuming a good creates positive externalities, _____.
(Multiple Choice)
4.9/5 (42)
Which of the following is true of open-access wildlife resources?
(Multiple Choice)
4.8/5 (34)
According to the Coase theorem, _____ in order to solve a negative externality problem efficiently.
(Multiple Choice)
4.9/5 (35)
Economists view pollution as an economic problem that arises because:
(Multiple Choice)
4.9/5 (35)
To enhance social welfare, the government should encourage the production of:
(Multiple Choice)
4.9/5 (43)
Which of the following is not an example of an open-access resource?
(Multiple Choice)
4.8/5 (35)
Pollution occurs because property rights to exhaustible resources are well defined.
(True/False)
4.8/5 (25)
Suppose environmental groups pressure the local government to reduce the number of pollution rights to be sold. Other things equal, ______.
(Multiple Choice)
4.8/5 (35)
The following graph shows the demand, the supply, and the marginal social benefit curves. The graph shows market equilibrium in the presence of ______.
Figure 17.6
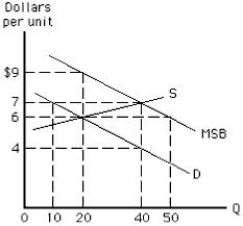
(Multiple Choice)
4.8/5 (30)
The following graph shows the market for pollution rights. The shift of the demand curve from D to D' indicates that ______.
Figure 17.4
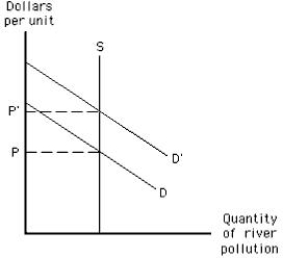
(Multiple Choice)
4.9/5 (31)
In order to increase society's well-being, measles vaccinations should be:
(Multiple Choice)
4.9/5 (38)
Filters
- Essay(0)
- Multiple Choice(0)
- Short Answer(0)
- True False(0)
- Matching(0)