Exam 5: Elasticity of Demand and Supply
Exam 1: The Art and Science of Economic Analysis150 Questions
Exam 2: Economic Tools and Economic Systems159 Questions
Exam 3: Economic Decision Makers174 Questions
Exam 4: Demand, Supply, and Markets152 Questions
Exam 5: Elasticity of Demand and Supply149 Questions
Exam 6: Consumer Choice and Demand150 Questions
Exam 7: Production and Cost in the Firm151 Questions
Exam 8: Perfect Competition150 Questions
Exam 9: Monopoly150 Questions
Exam 10: Monopolistic Competition and Oligopoly150 Questions
Exam 11: Resource Markets150 Questions
Exam 12: Labor Markets and Labor Unions150 Questions
Exam 13: Capital, Interest, Entrepreneurship, and Corporate Finance150 Questions
Exam 14: Transaction Costs, Asymmetric Information, and Behavioral Economics152 Questions
Exam 15: Economic Regulation and Antitrust Policy150 Questions
Exam 16: Public Goods and Public Choice150 Questions
Exam 17: Externalities and the Environment150 Questions
Exam 18: Poverty and Redistribution150 Questions
Exam 19: International Trade150 Questions
Exam 20: International Finance150 Questions
Exam 21: Economic Development150 Questions
Select questions type
Figure 5.5 shows the total revenue curve for a firm. Which of the following statements is true in the range of the total revenue curve labeled B?
Figure 5.5.

(Multiple Choice)
4.9/5  (43)
(43)
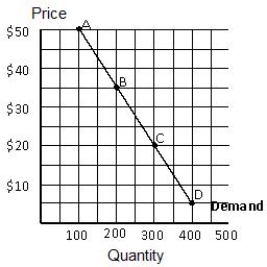
Figure 5.3 shows a linear demand curve. As you move from point B to point C along the demand curve, total revenue _____ and the demand is _____.
Figure 5.3

(Multiple Choice)
4.8/5 (39)
Which of the following is a possible reason for the price elasticity of demand for cigarettes being large for young smokers?
(Multiple Choice)
4.9/5 (45)
When agricultural production increases, the total amount paid for agricultural products tends to:
(Multiple Choice)
4.7/5 (31)
If people have more time to adjust to a price change, the price elasticity of demand for that good is likely to:
(Multiple Choice)
4.8/5 (38)
Figure 5.3 shows a linear demand curve. Between points A and B, the demand is:
Figure 5.3
(Multiple Choice)
4.8/5 (38)
If an increase in the price of a product from $1 to $2 per unit leads to a decrease in the quantity demanded from 100 to 80 units, then the value of the price elasticity of demand is:
(Multiple Choice)
4.7/5 (39)
If the income elasticity of demand for a service is 0.6, then a 5 percent increase in income will generate a _____ in quantity demanded.
(Multiple Choice)
4.9/5 (31)
Inferior goods have an income elasticity of demand that is:
(Multiple Choice)
4.9/5 (32)
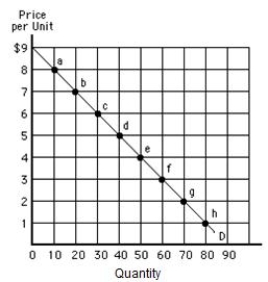
Figure 5.4 shows a downward-sloping linear demand curve. Between points b and c in the figure below, price decreases by $1, quantity demanded increases by 10, _____.
Figure 5.4
(Multiple Choice)
5.0/5 (31)
If a firm facing a perfectly elastic demand curve raises its price, then:
(Multiple Choice)
4.9/5 (37)
Figure 5.3 shows a linear demand curve. As you move from point A to point B along the demand curve, total revenue _____ and the demand is _____.
Figure 5.3

(Multiple Choice)
4.8/5 (39)
Wheat farmers in Kansas would benefit from a devastating crop failure in North Dakota (another major wheat-producing state) if the U.S. demand for wheat is:
(Multiple Choice)
4.8/5 (41)
Table 5.6 shows the change in the quantity demanded for Good A and Good B as a result of a change in income. Use the information in the table below to calculate the value of the income elasticity of demand for Good B.
Table 5.6
Quantity
Income
Good A
100
$1,000
120
$2,000
Good B
200
$20
140
$35
(Multiple Choice)
4.8/5 (47)
Along a linear demand curve, as the price increases from zero:
(Multiple Choice)
4.8/5 (41)
Identify a statement that is true about a linear demand curve.
(Multiple Choice)
4.8/5 (40)
If income rises and the demand for a product remains unchanged, the income elasticity of demand for that product is unit elastic.
(True/False)
4.9/5 (41)
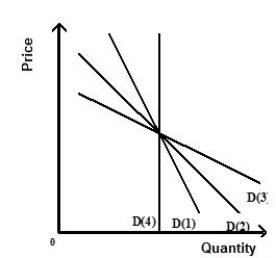
Figure 5.7 shows four demand curves. The demand curve that best illustrates how consumers will respond to a change in price over a very long time period is: Figure 5.7
(Multiple Choice)
4.9/5 (38)
Filters
- Essay(0)
- Multiple Choice(0)
- Short Answer(0)
- True False(0)
- Matching(0)