Exam 17: Externalities and the Environment
Exam 1: The Art and Science of Economic Analysis150 Questions
Exam 2: Economic Tools and Economic Systems159 Questions
Exam 3: Economic Decision Makers174 Questions
Exam 4: Demand, Supply, and Markets152 Questions
Exam 5: Elasticity of Demand and Supply149 Questions
Exam 6: Consumer Choice and Demand150 Questions
Exam 7: Production and Cost in the Firm151 Questions
Exam 8: Perfect Competition150 Questions
Exam 9: Monopoly150 Questions
Exam 10: Monopolistic Competition and Oligopoly150 Questions
Exam 11: Resource Markets150 Questions
Exam 12: Labor Markets and Labor Unions150 Questions
Exam 13: Capital, Interest, Entrepreneurship, and Corporate Finance150 Questions
Exam 14: Transaction Costs, Asymmetric Information, and Behavioral Economics152 Questions
Exam 15: Economic Regulation and Antitrust Policy150 Questions
Exam 16: Public Goods and Public Choice150 Questions
Exam 17: Externalities and the Environment150 Questions
Exam 18: Poverty and Redistribution150 Questions
Exam 19: International Trade150 Questions
Exam 20: International Finance150 Questions
Exam 21: Economic Development150 Questions
Select questions type
The marginal social benefit curve for water quality slopes downward because:
(Multiple Choice)
4.7/5  (39)
(39)
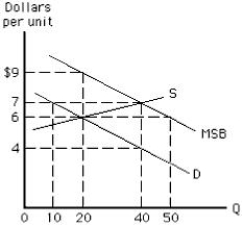
The following graph shows the demand, the supply, and the marginal social benefit curves. The socially efficient level of output is _______.
Figure 17.6
(Multiple Choice)
4.9/5 (35)
The socially efficient level of output is determined where:
(Multiple Choice)
4.8/5 (37)
Marginal social cost includes both the marginal private cost and the marginal external cost that production imposes on society.
(True/False)
4.7/5 (35)
If the marginal social cost of producing a good exceeds the marginal private cost, then:
(Multiple Choice)
4.8/5 (38)
An individual who listens to loud music late in the night is creating:
(Multiple Choice)
4.9/5 (44)
Which of the following accounts for the recent decline in the growth of trash-to-energy plants?
(Multiple Choice)
4.8/5 (41)
If the consumption of education creates a positive externality, then to increase efficiency relative to the outcome determined by private decisions, _____.
(Multiple Choice)
4.7/5 (41)
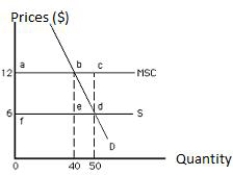
The following graph shows market equilibrium in the presence of an externality. The total social gain from producing the socially efficient output is:
Figure 17.2
(Multiple Choice)
4.9/5 (37)
The deforestation of rainforests due to human activities has increased because:
(Multiple Choice)
4.8/5 (44)
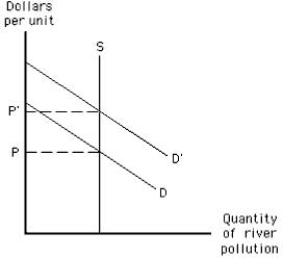
The following graph shows the market for pollution rights. The supply curve represents the amount of ______.
Figure 17.4
(Multiple Choice)
4.9/5 (35)
Markets tend to underproduce goods that generate positive externalities.
(True/False)
4.8/5 (45)
The main objective of the Comprehensive Environmental Response, Compensation, and Liability Act, was to ensure that:
(Multiple Choice)
4.9/5 (47)
Filters
- Essay(0)
- Multiple Choice(0)
- Short Answer(0)
- True False(0)
- Matching(0)