Exam 5: Birth, Death and Movement
Exam 1: Ecology and How to Do It50 Questions
Exam 2: Ecology’s Evolutionary Backdrop50 Questions
Exam 3: Physical Conditions and the Availability of Resources50 Questions
Exam 4: Climate and the World’s Biomes50 Questions
Exam 5: Birth, Death and Movement50 Questions
Exam 6: Interspecific Competition50 Questions
Exam 7: Predation, Grazing and Disease50 Questions
Exam 8: Molecular and Evolutionary Ecology50 Questions
Exam 9: From Populations to Communities50 Questions
Exam 10: Patterns in Species Richness50 Questions
Exam 11: The Flux of Energy and Matter Through Ecosystems50 Questions
Exam 12: Global Biogeochemical Cycles and Their Alteration by Humans50 Questions
Exam 13: Conservation Ecology51 Questions
Exam 14: The Ecology of Human Population Growth, Disease, and Food Supply51 Questions
Select questions type
What measurement gives an overall idea of whether a population has increased or decreased in a generation?
Free
(Multiple Choice)
4.8/5  (39)
(39)
Correct Answer: Verified
D
In Figure 5.9,how does probability of reproduction change as a function of leaf area? 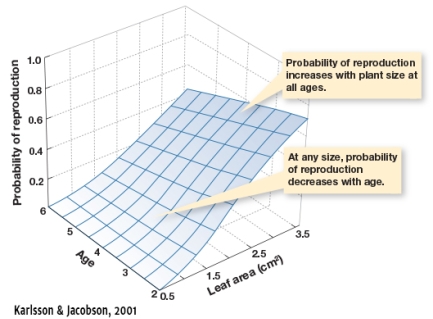
Free
(Multiple Choice)
4.9/5 (30)
Correct Answer:Verified
A
In Figure 5.5,from autumn to spring (March to October)what is the trend in nitrogen allocation to parts of the plant not directly involved with reproduction for this perennial plant from the Southern Hemisphere? 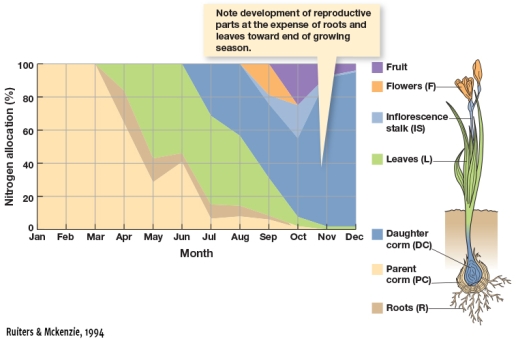
Free
(Multiple Choice)
4.8/5 (35)
Correct Answer:Verified
A
The mass movement of elk across North America is an example of ________?
(Multiple Choice)
4.8/5 (37)
Which of the following statements can you not conclude with any certainty is true based off the data depicted in Figure 5.3 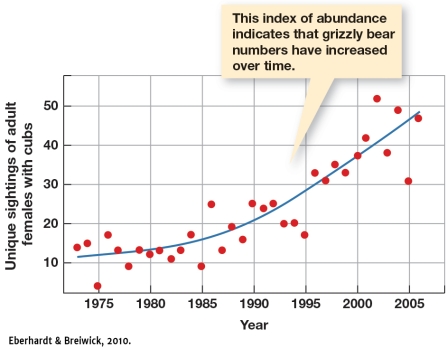
(Multiple Choice)
4.9/5 (38)
Which terms describe generalized spatial patterns that may be exhibited by organisms?
(Multiple Choice)
4.8/5 (40)
You are shopping at a plant nursery and come across a plant you have never seen.The sign indicates it is a flowering biennial.What should you already know about this plant?
(Multiple Choice)
4.8/5 (37)
You are doing a research project to determine the age of maple trees in a series of 100 square meter plots.Your data are interesting because many of the trees that are the same age are not the same size,even though they are within a few kilometers of one another.Why might this be?
(Multiple Choice)
4.8/5 (32)
If birth and death rates are density dependent,then the density of a population will cycle near ______________
(Multiple Choice)
4.8/5 (24)
You have studied a population of garter snakes to understand how recruitment changes over time.When the density of snakes was at an average of 5 per 50 square meters recruitment was low.When that density increased to 20 per 50 square meters recruitment was also low.However,when densities were near 12 garter snakes per 50 square meters recruitment was at its highest.This is an example of a ___________ curve.
(Multiple Choice)
4.9/5 (41)
Which method would you employ if you wanted to create a life table for a population of tamarinds?
(Multiple Choice)
4.9/5 (29)
If you were going to concisely describe an annual,what would you say?
(Multiple Choice)
4.8/5 (33)
You are running an experiment in the laboratory to study the population growth of a species of Tribolium spp..You notice that the population multiplies over each successive interval of time.The growth of this population is therefore _____________.
(Multiple Choice)
4.9/5 (31)
Filters
- Essay(0)
- Multiple Choice(0)
- Short Answer(0)
- True False(0)
- Matching(0)