Exam 23: Aggregate Expenditure and Output in the Short Run
Exam 1: Economics: Foundations and Models142 Questions
Exam 2: Trade-Offs, comparative Advantage, and the Market System152 Questions
Exam 3: Where Prices Come From: the Interaction of Demand and Supply149 Questions
Exam 4: Economic Efficiency, government Price Setting, and Taxes137 Questions
Exam 5: Externalities, environmental Policy, and Public Goods139 Questions
Exam 6: Elasticity: The Responsiveness of Demand and Supply149 Questions
Exam 7: The Economics of Health Care117 Questions
Exam 8: Firms, the Stock Market, and Corporate Governance140 Questions
Exam 9: Comparative Advantage and the Gains From International Trade124 Questions
Exam 10: Consumer Choice and Behavioral Economics154 Questions
Exam 11: Technology, production, and Costs174 Questions
Exam 12: Firms in Perfectly Competitive Markets153 Questions
Exam 13: Monopolistic Competition: The Competitive Model in a More Realistic Setting137 Questions
Exam 14: Oligopoly: Firms in Less Competitive Markets129 Questions
Exam 15: Monopoly and Antitrust Policy148 Questions
Exam 16: Pricing Strategy134 Questions
Exam 17: The Markets for Labor and Other Factors of Production149 Questions
Exam 18: Public Choice, taxes, and the Distribution of Income134 Questions
Exam 19: GDP: Measuring Total Production and Income135 Questions
Exam 20: Unemployment and Inflation148 Questions
Exam 21: Economic Growth, the Financial System, and Business Cycles130 Questions
Exam 22: Long-Run Economic Growth: Sources and Policies134 Questions
Exam 23: Aggregate Expenditure and Output in the Short Run157 Questions
Exam 24: Aggregate Demand and Aggregate Supply Analysis145 Questions
Exam 25: Money, banks, and the Federal Reserve System144 Questions
Exam 26: Monetary Policy145 Questions
Exam 27: Fiscal Policy155 Questions
Exam 28: Inflation, unemployment, and Federal Reserve Policy135 Questions
Exam 29: Macroeconomics in an Open Economy145 Questions
Exam 30: The International Financial System139 Questions
Select questions type
Figure 23-1 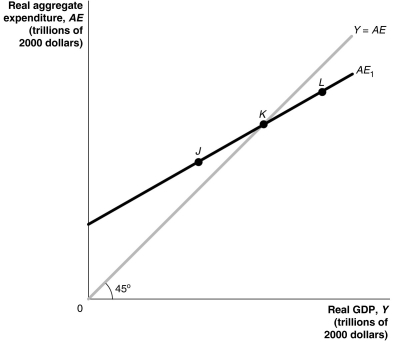 -Refer to Figure 23-1.According to the figure above,at what point is aggregate expenditure greater than GDP?
Free
(Multiple Choice)
4.7/5  (42)
(42)
Correct Answer: Verified
A
An increase in the price level in the United States will reduce exports and increase imports.
Free
(True/False)
4.9/5 (27)
Correct Answer:Verified
True
If planned aggregate expenditure is below potential GDP and planned aggregate expenditure equals GDP,then
Free
(Multiple Choice)
4.8/5 (47)
Correct Answer:Verified
C
If planned investment is greater than actual investment,then aggregate expenditure is less than GDP.
(True/False)
4.8/5 (34)
If aggregate expenditure is less than GDP,how will the economy reach macroeconomic equilibrium?
(Multiple Choice)
4.7/5 (47)
The passage of the Smoot-Hawley Tariff in 1930 sparked a trade war that caused net exports to ________ and real GDP to ________.
(Multiple Choice)
4.9/5 (40)
If consumption is defined as C = 2,000 + 0.8Y,then the marginal propensity to save is 0.8.
(True/False)
4.9/5 (30)
Figure 23-3 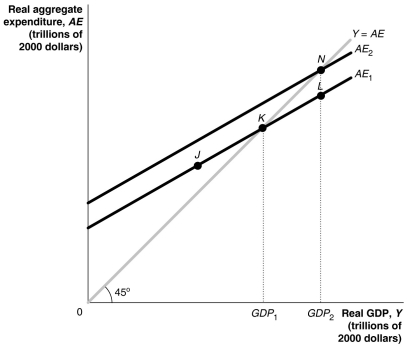 -Refer to Figure 23-3.Suppose that government spending increases,shifting up the aggregate expenditure line.GDP increases from GDP1 to GDP2,and this amount is $400 billion.If the MPC is 0.75,then what is the distance between N and L or by how much did government spending change?
(Multiple Choice)
4.8/5 (33)
Discuss the leading causes of the Great Depression.Use the 45-degree line diagram to show how they caused a decline in GDP.
(Essay)
4.8/5 (41)
Figure 23-1
-Refer to Figure 23-1.If the economy is at point L,what will happen?
(Multiple Choice)
4.9/5 (29)
In the aggregate expenditure model,________ has both an autonomous component and an induced component.
(Multiple Choice)
4.8/5 (46)
C = 2,550 + (MPC)Y
I = 800
G = 1,100
NX = 50
If the equilibrium level of GDP is $11,250,using the equations for C,I,G,and NX shown above,find the value of the marginal propensity to consume.
(Essay)
4.9/5 (28)
Which of the following will cause a direct increase in consumption spending?
(Multiple Choice)
4.9/5 (38)
Given the equations for C,I,G,and NX below,what is the marginal propensity to consume? C = 2,000 + 0.9Y
I = 2,500
G = 3,000
NX = 400
(Multiple Choice)
4.9/5 (41)
Filters
- Essay(0)
- Multiple Choice(0)
- Short Answer(0)
- True False(0)
- Matching(0)