Exam 13: Monopolistic Competition: The Competitive Model in a More Realistic Setting
Exam 1: Economics: Foundations and Models142 Questions
Exam 2: Trade-Offs, comparative Advantage, and the Market System152 Questions
Exam 3: Where Prices Come From: the Interaction of Demand and Supply149 Questions
Exam 4: Economic Efficiency, government Price Setting, and Taxes137 Questions
Exam 5: Externalities, environmental Policy, and Public Goods139 Questions
Exam 6: Elasticity: The Responsiveness of Demand and Supply149 Questions
Exam 7: The Economics of Health Care117 Questions
Exam 8: Firms, the Stock Market, and Corporate Governance140 Questions
Exam 9: Comparative Advantage and the Gains From International Trade124 Questions
Exam 10: Consumer Choice and Behavioral Economics154 Questions
Exam 11: Technology, production, and Costs174 Questions
Exam 12: Firms in Perfectly Competitive Markets153 Questions
Exam 13: Monopolistic Competition: The Competitive Model in a More Realistic Setting137 Questions
Exam 14: Oligopoly: Firms in Less Competitive Markets129 Questions
Exam 15: Monopoly and Antitrust Policy148 Questions
Exam 16: Pricing Strategy134 Questions
Exam 17: The Markets for Labor and Other Factors of Production149 Questions
Exam 18: Public Choice, taxes, and the Distribution of Income134 Questions
Exam 19: GDP: Measuring Total Production and Income135 Questions
Exam 20: Unemployment and Inflation148 Questions
Exam 21: Economic Growth, the Financial System, and Business Cycles130 Questions
Exam 22: Long-Run Economic Growth: Sources and Policies134 Questions
Exam 23: Aggregate Expenditure and Output in the Short Run157 Questions
Exam 24: Aggregate Demand and Aggregate Supply Analysis145 Questions
Exam 25: Money, banks, and the Federal Reserve System144 Questions
Exam 26: Monetary Policy145 Questions
Exam 27: Fiscal Policy155 Questions
Exam 28: Inflation, unemployment, and Federal Reserve Policy135 Questions
Exam 29: Macroeconomics in an Open Economy145 Questions
Exam 30: The International Financial System139 Questions
Select questions type
Table 13-3
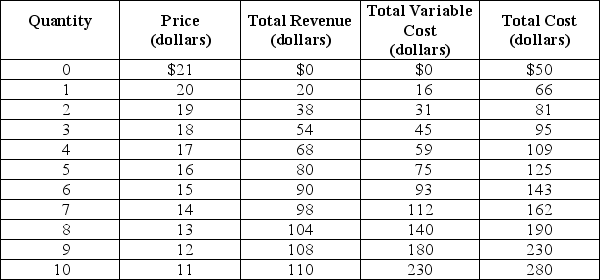 Table 13-3 shows the demand and cost schedules for a monopolistically competitive firm.
-Refer to Table 13-3.What is its average variable cost of production at its optimal output level?
Table 13-3 shows the demand and cost schedules for a monopolistically competitive firm.
-Refer to Table 13-3.What is its average variable cost of production at its optimal output level?
Free
(Multiple Choice)
4.8/5  (29)
(29)
Correct Answer: Verified
C
When a monopolistically competitive firm cuts its price to increase its sales,it experiences a gain in revenue due to the
Free
(Multiple Choice)
5.0/5 (40)
Correct Answer:Verified
D
If a firm has excess capacity,it means
Free
(Multiple Choice)
4.8/5 (36)
Correct Answer:Verified
B
In monopolistic competition,if a firm produces a highly desirable product relative to its competitors,the firm will be able to raise its price without losing any customers.
(True/False)
4.7/5 (45)
Figure 13-10  -Refer to Figure 13-10.In the long run,why will the firm produce Qf units and not Qg units,which has a lower its average cost of production?
(Multiple Choice)
4.7/5 (37)
Long-run equilibrium under monopolistic competition is similar to that under perfect competition in that
(Multiple Choice)
4.9/5 (32)
In the short run,a profit-maximizing firm's decision to produce should be guided by whether
(Multiple Choice)
4.9/5 (34)
Which of the following statements is true about advertising by a monopolistically competitive firm?
(Multiple Choice)
4.8/5 (36)
Figure 13-3 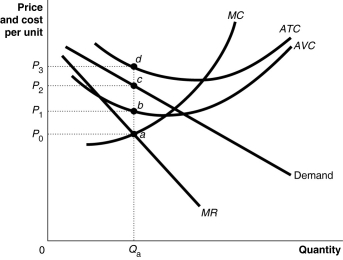 Figure 13-3 shows short-run cost and demand curves for a monopolistically competitive firm in the market for designer watches.
-Refer to Figure 13-3.What is the area that represents the loss made by the firm?
Figure 13-3 shows short-run cost and demand curves for a monopolistically competitive firm in the market for designer watches.
-Refer to Figure 13-3.What is the area that represents the loss made by the firm?
(Multiple Choice)
4.9/5 (37)
Draw a graph that shows the impact on a firm's profit when it increases spending on advertising and the increased advertising has no effect on the demand for a firm's product.
(Essay)
4.8/5 (42)
Figure 13-3
Figure 13-3 shows short-run cost and demand curves for a monopolistically competitive firm in the market for designer watches.
-Refer to Figure 13-3.What is the area that represents the total variable cost of production?
(Multiple Choice)
4.9/5 (32)
Figure 13-3
Figure 13-3 shows short-run cost and demand curves for a monopolistically competitive firm in the market for designer watches.
-Refer to Figure 13-3.What is the area that represents the total revenue made by the firm?
(Multiple Choice)
4.8/5 (33)
If a monopolistically competitive firm breaks even,the firm is earning as much in this industry as it could in any other comparable industry.
(True/False)
4.8/5 (31)
If buyers of a monopolistically competitive product feel the products of different sellers have little differences between them,then the demand for each seller's product is relatively elastic.
(True/False)
4.7/5 (48)
Figure 13-6 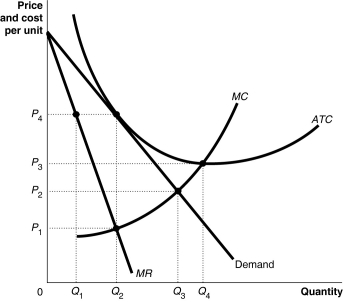 -Refer to Figure 13-6.What is the allocatively efficient output for the firm represented in the diagram?
(Multiple Choice)
4.8/5 (41)
If the demand curve for a firm is downward-sloping,its marginal revenue curve
(Multiple Choice)
4.8/5 (34)
The financial situation at Starbucks in the late 2000s illustrates the fact that maintaining long-run profits in a monopolistically competitive market is
(Multiple Choice)
4.9/5 (39)
Filters
- Essay(0)
- Multiple Choice(0)
- Short Answer(0)
- True False(0)
- Matching(0)