Exam 3: Where Prices Come From: the Interaction of Demand and Supply
Exam 1: Economics: Foundations and Models233 Questions
Exam 2: Trade-Offs, comparative Advantage, and the Market System259 Questions
Exam 3: Where Prices Come From: the Interaction of Demand and Supply242 Questions
Exam 4: Economic Efficiency, government Price Setting, and Taxes208 Questions
Exam 5: Externalities, environmental Policy, and Public Goods267 Questions
Exam 6: Elasticity: The Responsiveness of Demand and Supply295 Questions
Exam 7: The Economics of Health Care169 Questions
Exam 8: Firms, the Stock Market, and Corporate Governance278 Questions
Exam 9: Comparative Advantage and the Gains From International Trade189 Questions
Exam 10: Consumer Choice and Behavioral Economics302 Questions
Exam 11: Technology, production, and Costs330 Questions
Exam 12: Firms in Perfectly Competitive Markets298 Questions
Exam 13: Monopolistic Competition: the Competitive Model in a More Realistic Setting278 Questions
Exam 14: Oligopoly: Firms in Less Competitive Markets262 Questions
Exam 15: Monopoly and Antitrust Policy271 Questions
Exam 16: Pricing Strategy263 Questions
Exam 17: The Markets for Labor and Other Factors of Production286 Questions
Exam 18: Public Choice,taxes,and the Distribution of Income258 Questions
Select questions type
Table 3-1
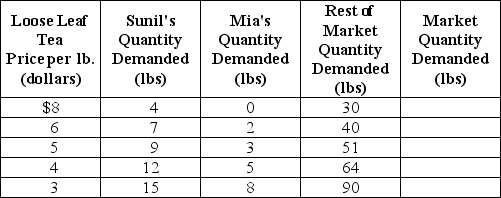 -Refer to Table 3-1.The table above shows the demand schedules for loose-leaf tea of two individuals (Sunil and Mia)and the rest of the market.At a price of $5,the quantity demanded in the market would be
(Multiple Choice)
4.9/5  (32)
(32)
Figure 3-1 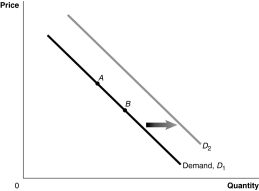 -Refer to Figure 3-1.A decrease in the price of a substitute good would be represented by a movement from
(Multiple Choice)
4.8/5 (27)
Explain the differences between a change in supply and a change in quantity supplied.
(Essay)
4.7/5 (37)
The income effect of a price change refers to the change in the quantity demanded of a good that results from a change in the price of a complementary product.
(True/False)
4.9/5 (39)
Assume that the hourly price for the services of tarot card readers has risen and sales of these services have also risen.One can conclude that
(Multiple Choice)
4.9/5 (42)
Refer to the Article Summary.If more European governments and hospitals begin to offer and publicize their services to American medical tourists and,due to the growing number of aging baby boomers,more Americans desire joint-replacement surgery ,what will happen in the market for joint-replacement surgery as a result of these two factors?
(Multiple Choice)
4.9/5 (32)
The income effect explains why there is an inverse relationship between the price of a product and the quantity of the product demanded.
(True/False)
5.0/5 (41)
An decrease in quantity supplied is represented by a leftward shift of the supply curve.
(True/False)
4.8/5 (33)
Figure 3-7 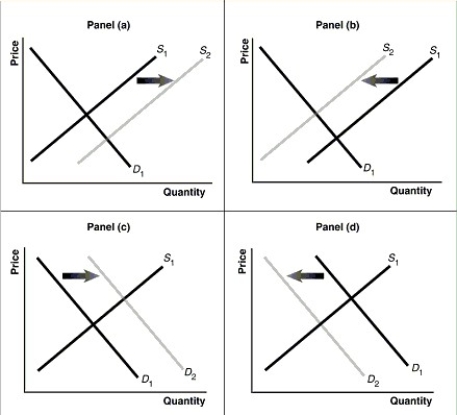 -Refer to Figure 3-7.Assume that the graphs in this figure represent the demand and supply curves for bicycle helmets.Which panel best describes what happens in this market if there is a substantial increase in the price of bicycles?
(Multiple Choice)
4.9/5 (34)
An article in the Wall Street Journal in early 2001 noted two developments in the market for laser eye surgery.The first development concerned side effects from the surgery,including blurred vision.The second development was that the companies renting eye-surgery machinery to doctors had reduced their charges.In the market for laser eye surgeries,these two developments
(Multiple Choice)
4.9/5 (31)
Let D= demand,S = supply,P = equilibrium price,Q= equilibrium quantity.What happens in the market for walnuts if the Centers for Disease Control and Prevention announces that consuming a half cup of walnuts each week helps to lower bad levels of cholesterol?
(Multiple Choice)
4.8/5 (29)
Select the phrase that correctly completes the following statement."A positive change in technology caused an increase in the supply of flat-screen televisions.As a result ________."
(Multiple Choice)
4.7/5 (40)
In recent years the cost of producing organic produce in the U.S.has decreased largely due technological advancement.At the same time,more and more Americans prefer organic produce over conventional produce.Which of the following best explains the effect of these events in the organic produce market?
(Multiple Choice)
4.8/5 (25)
Figure 3-5 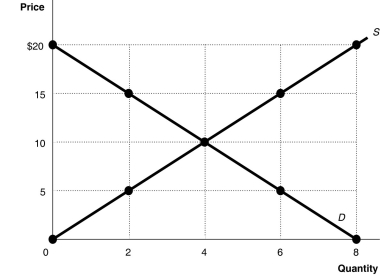 -Refer to Figure 3-5.In a free market such as that depicted above,a surplus is eliminated by
(Multiple Choice)
4.9/5 (33)
Table 3-1
-Refer to Table 3-1.The table above shows the demand schedules for loose-leaf tea of two individuals (Sunil and Mia)and the rest of the market.If the price of loose-leaf tea rises from $3 to $4,the market quantity demanded would
(Multiple Choice)
4.8/5 (31)
Last year,the Pottery Palace supplied 8,000 ceramic pots at $40 each.This year,the company supplied the same quantity of ceramic pots at $55 each.Based on this evidence,The Pottery Palace has experienced
(Multiple Choice)
4.8/5 (38)
If the price of refillable butane lighters was to decrease,then
(Multiple Choice)
4.9/5 (35)
Figure 3-1
-Refer to Figure 3-1.A decrease in the price of a complementary good would be represented by a movement from
(Multiple Choice)
4.8/5 (36)
Filters
- Essay(0)
- Multiple Choice(0)
- Short Answer(0)
- True False(0)
- Matching(0)