Exam 3: Where Prices Come From: the Interaction of Demand and Supply
Exam 1: Economics: Foundations and Models233 Questions
Exam 2: Trade-Offs, comparative Advantage, and the Market System259 Questions
Exam 3: Where Prices Come From: the Interaction of Demand and Supply242 Questions
Exam 4: Economic Efficiency, government Price Setting, and Taxes208 Questions
Exam 5: Externalities, environmental Policy, and Public Goods267 Questions
Exam 6: Elasticity: The Responsiveness of Demand and Supply295 Questions
Exam 7: The Economics of Health Care169 Questions
Exam 8: Firms, the Stock Market, and Corporate Governance278 Questions
Exam 9: Comparative Advantage and the Gains From International Trade189 Questions
Exam 10: Consumer Choice and Behavioral Economics302 Questions
Exam 11: Technology, production, and Costs330 Questions
Exam 12: Firms in Perfectly Competitive Markets298 Questions
Exam 13: Monopolistic Competition: the Competitive Model in a More Realistic Setting278 Questions
Exam 14: Oligopoly: Firms in Less Competitive Markets262 Questions
Exam 15: Monopoly and Antitrust Policy271 Questions
Exam 16: Pricing Strategy263 Questions
Exam 17: The Markets for Labor and Other Factors of Production286 Questions
Exam 18: Public Choice,taxes,and the Distribution of Income258 Questions
Select questions type
"The price of compact fluorescent light bulbs fell because of improvements in production technology.As a result,the demand for incandescent light bulbs decreased.This caused the price of incandescent light bulbs to fall; as the price of incandescent light bulbs fell the demand for incandescent light bulbs decreased even further." Evaluate this statement.
(Multiple Choice)
4.7/5  (38)
(38)
Figure 3-5 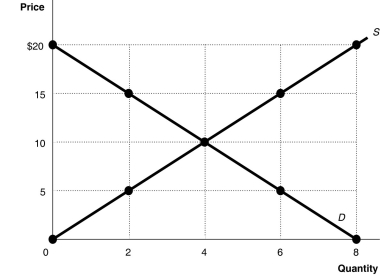 -Refer to Figure 3-5.At a price of $10,the quantity sold
(Multiple Choice)
4.9/5 (32)
For each of the following pairs of products state which are complements,which are substitutes,and which are unrelated.
a.Blu-ray discs and video-on-demand
b.Fiat 500 and Mini Cooper S
c.Toothpaste and toothbrush
d.Popcorn and snowboards
e.Razors and razor blades
(Essay)
4.7/5 (29)
Figure 3-7 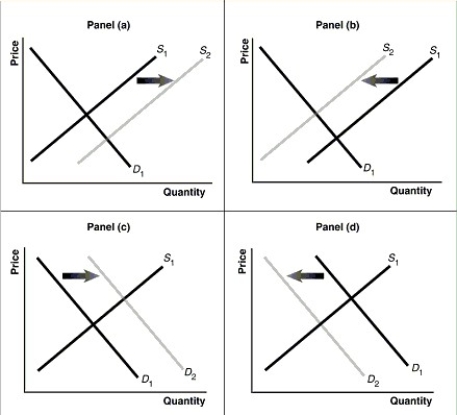 -Refer to Figure 3-7.Assume that the graphs in this figure represent the demand and supply curves for used clothing,an inferior good.Which panel describes what happens in this market as a result of a decrease in income?
(Multiple Choice)
4.8/5 (33)
Figure 3-6 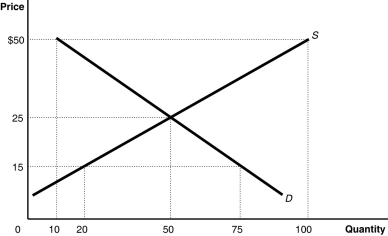 -Refer to Figure 3-6.The figure above represents the market for canvas tote bags.Assume that the price of tote bags is $15.At this price
(Multiple Choice)
4.9/5 (19)
Assume that both the demand curve and the supply curve for MP3 players shift to the right but the demand curve shifts more than the supply curve.As a result
(Multiple Choice)
4.9/5 (40)
Suppose that when the price of hamburgers decreases,the Landry family decreases their purchases of chicken nuggets.To the Landry family
(Multiple Choice)
4.8/5 (42)
If a decrease in income leads to an increase in the demand for sardines,then sardines are
(Multiple Choice)
4.8/5 (37)
Figure 3-7
-Refer to Figure 3-7.Assume that the graphs in this figure represent the demand and supply curves for Fruitopia,a soft drink.Which panel describes what happens in the market for Fruitopia when the price of Snapple,a substitute product,decreases?
(Multiple Choice)
4.8/5 (39)
In 2004,hurricanes destroyed a large portion of Florida's grapefruit crop.How did this affect the market price and market quantity of grapefruit?
(Essay)
4.8/5 (39)
Auctions in recent years have resulted in higher prices paid for letters written by John Wilkes Booth than those written by Abraham Lincoln.What is a reason for this difference in price?
(Multiple Choice)
4.7/5 (35)
Figure 3-6
-Refer to Figure 3-6.The figure above represents the market for canvas tote bags.Compare the conditions in the market when the price is $50 and when the price is $35.Which of the following describes how the market differs at these prices?
(Multiple Choice)
4.8/5 (43)
Which of the following would cause a decrease in the equilibrium price and an increase in the equilibrium quantity of salmon?
(Multiple Choice)
4.8/5 (28)
Figure 3-7
-Refer to Figure 3-7.Assume that the graphs in this figure represent the demand and supply curves for almonds.Which panel best describes what happens in this market when there is an increase in the productivity of almond harvesters?
(Multiple Choice)
4.9/5 (42)
Figure 3-2 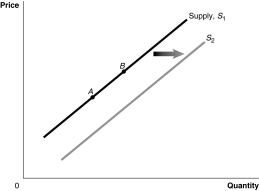 -Refer to Figure 3-2.A decrease in the price of the product would be represented by a movement from
(Multiple Choice)
4.8/5 (30)
Figure 3-1 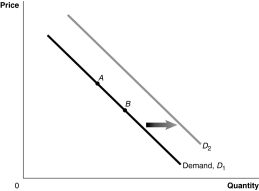 -Refer to Figure 3-1.A decrease in taste or preference would be represented by a movement from
(Multiple Choice)
5.0/5 (35)
Figure 3-1
-Refer to Figure 3-1.An increase in population would be represented by a movement from
(Multiple Choice)
4.8/5 (20)
Assume that the demand curve for MP3 players shifts to the right and the supply curve for MP3 players shift to the left,but the supply curve shifts more than the demand curve.As a result
(Multiple Choice)
4.8/5 (30)
Filters
- Essay(0)
- Multiple Choice(0)
- Short Answer(0)
- True False(0)
- Matching(0)