Exam 13: Aggregate Demand and Aggregate Supply
Exam 1: The Role and Method of Economics99 Questions
Exam 2: The Economic Way of Thinking100 Questions
Exam 3: Supply and Demand99 Questions
Exam 4: Using Supply and Demand100 Questions
Exam 5: Market Failure and Public Choice100 Questions
Exam 6: Production and Costs99 Questions
Exam 7: Firms in Perfectly Competitive Markets100 Questions
Exam 8: Monopoly100 Questions
Exam 9: Monopolistic Competition and Oligopoly100 Questions
Exam 10: Labor Markets, Income Distribution, and Poverty100 Questions
Exam 11: Introduction to Macroeconomics: Unemployment, Inflation, and Economic Fluctuations101 Questions
Exam 12: Economic Growth99 Questions
Exam 13: Aggregate Demand and Aggregate Supply100 Questions
Exam 14: Fiscal Policy100 Questions
Exam 15: Monetary Institutions100 Questions
Exam 16: The Federal Reserve and Monetary Policy100 Questions
Exam 17: Issues in Macroeconomic Theory and Policy74 Questions
Exam 18: International Economics100 Questions
Select questions type
Figure 13-7 shows the short-run macroeconomic equilibrium of an economy. In the figure, starting at Point A, a decrease in aggregate demand would result in:Figure 13-7 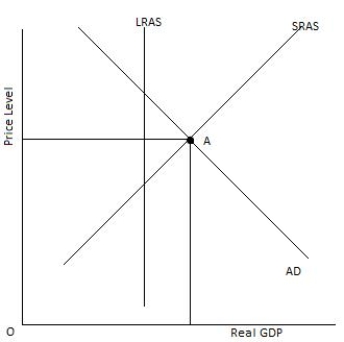
(Multiple Choice)
4.8/5  (44)
(44)
Figure 13-6 shows the short-run macroeconomic equilibrium of an economy. Which of the following will happen in the short run if there is a decrease in aggregate demand?Figure 13-6 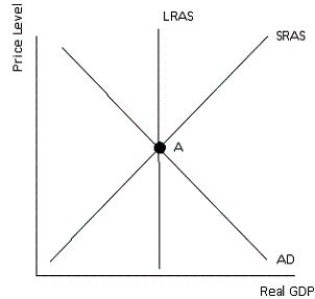
(Multiple Choice)
4.8/5 (42)
Which of the following will decrease aggregate demand in an economy?
(Multiple Choice)
4.8/5 (31)
Figure 13-2 shows shifts in the aggregate demand curve. Which of the following combinations would be illustrated by a shift in aggregate demand from AD0 to AD2?Figure 13-2 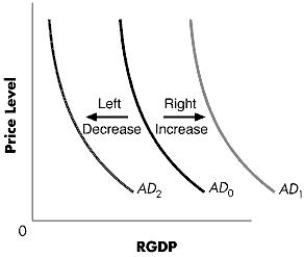
(Multiple Choice)
4.8/5 (41)
Discuss the difference between an increase in the aggregate demand curve and an increase in the quantity of real GDP demanded. Include discussion of how the price level relates to each event.
(Essay)
4.9/5 (40)
Ceteris paribus, which of the following would cause the aggregate demand curve to shift to the left?
(Multiple Choice)
4.8/5 (32)
The figure below shows the relationship between the real GDP and the price level of an economy. In the figure, _____ represents aggregate demand.Figure 13-1 
(Multiple Choice)
4.8/5 (41)
Explain why the short-run supply curve is not vertical, but the long-run aggregate supply curve is vertical.
(Essay)
4.9/5 (39)
The interest rate effect suggests that the negative slope of the aggregate demand curve results, at least in part, because changes in the price level affect:
(Multiple Choice)
4.7/5 (31)
The long-run aggregate supply curve is the relationship between the price level and the quantity of real GDP that is supplied once input prices have had time to fully adjust to that price level.
(True/False)
4.8/5 (30)
Figure 13-3 shows the relationship between real GDP and the price level in an economy. In the figure, _____ represents short-run aggregate supply?Figure 13-3 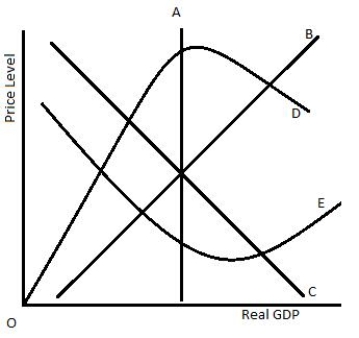
(Multiple Choice)
4.9/5 (34)
Holding all other things constant, when the price level rises, interest rates:
(Multiple Choice)
4.9/5 (39)
Which of the following is a difference between the short-run aggregate supply curve and the long-run aggregate supply curve?
(Multiple Choice)
4.9/5 (49)
Sam prefers holding his savings as cash in his house. Currently, the economy is experiencing an increasing price level. He can conclude that:
(Multiple Choice)
4.9/5 (36)
When there is a recessionary gap, one is likely to see an increase in overtime work.
(True/False)
4.8/5 (32)
Faster growth rates of a nation's major trading partner combined with an increase in the nation's stock market wealth would:
(Multiple Choice)
4.8/5 (44)
Filters
- Essay(0)
- Multiple Choice(0)
- Short Answer(0)
- True False(0)
- Matching(0)