Exam 22: The Short Run Trade Off Between Inflation and Unemployment: The Phillips Curve
Exam 1: Ten Principles of Economics24 Questions
Exam 1: Ten Principles of Economics: How People Make Decisions139 Questions
Exam 1: Ten Principles of Economics: How People Interact103 Questions
Exam 1: Ten Principles of Economics: How the Economy As a Whole Works73 Questions
Exam 1: Ten Principles of Economics: Part A53 Questions
Exam 1: Ten Principles of Economics: Part B51 Questions
Exam 2: Thinking Like an Economist2 Questions
Exam 2: Thinking Like an Economist: The Economist As Scientist256 Questions
Exam 2: Thinking Like an Economist: The Economist As Policy Adviser67 Questions
Exam 2: Thinking Like an Economist: Why Economists Disagree17 Questions
Exam 2: Thinking Like an Economist: Lets Get Going6 Questions
Exam 2: Thinking Like an Economist: Graphing a Brief Review68 Questions
Exam 2: Thinking Like an Economist: Part A56 Questions
Exam 2: Thinking Like an Economist: Part B136 Questions
Exam 3: Interdependence and the Gains From Trade2 Questions
Exam 3: Interdependence and the Gains From Trade: A Parable for the Modern Economy60 Questions
Exam 3: Interdependence and the Gains From Trade: Comparative Advantage the Driving Force of Specialization141 Questions
Exam 3: Interdependence and the Gains From Trade: Applications of Comparative Advantage20 Questions
Exam 3: Interdependence and the Gains From Trade: Conclusion1 Questions
Exam 3: Interdependence and the Gains From Trade: Part A40 Questions
Exam 3: Interdependence and the Gains From Trade: Part B69 Questions
Exam 4: The Market Forces of Supply and Demand3 Questions
Exam 4: The Market Forces of Supply and Demand:Markets and Competition46 Questions
Exam 4: The Market Forces of Supply and Demand: Demand150 Questions
Exam 4: The Market Forces of Supply and Demand: Supply96 Questions
Exam 4: The Market Forces of Supply and Demand: Supply and Demand Together158 Questions
Exam 4: The Market Forces of Supply and DemandConclusion How Prices Allocate Resources5 Questions
Exam 4: The Market Forces of Supply and Demand: Part A38 Questions
Exam 4: The Market Forces of Supply and Demand: Part B108 Questions
Exam 5: Elasticity and Its Applications6 Questions
Exam 5: Elasticity and Its Applications: The Elasticity of Demand303 Questions
Exam 5: Elasticity and Its Applications: The Elasticity of Supply86 Questions
Exam 5:Elasticity and Its Applications: Three Applications of Supply,demand,and Elasticity48 Questions
Exam 5: Elasticity and Its Applications: Part A49 Questions
Exam 5: Elasticity and Its Applications: Part B78 Questions
Exam 6: Supply Demand and Government Policies5 Questions
Exam 6: Supply Demand and Government Policies: Controls on Prices215 Questions
Exam 6: Supply Demand and Government Policies: Taxes199 Questions
Exam 6: Supply Demand and Government Policies: Part A46 Questions
Exam 6: Supply Demand and Government Policies: Part B166 Questions
Exam 7: Consumers Producers and the Efficiency of Markets10 Questions
Exam 7: Consumers Producers and the Efficiency of Markets: Consumer Surplus98 Questions
Exam 7: Consumers Producers and the Efficiency of Markets: Producer Surplus92 Questions
Exam 7: Consumers Producers and the Efficiency of Markets: Market Efficiency123 Questions
Exam 7: Consumers Producers and the Efficiency of Markets: Conclusion Market Efficiency and Market Failure7 Questions
Exam 7: Consumers Producers and the Efficiency of Markets: Part A46 Questions
Exam 7: Consumers Producers and the Efficiency of Markets: Part B65 Questions
Exam 8: Application the Cost of Taxation5 Questions
Exam 8: Application the Cost of Taxation: The Deadweight Loss of Taxation247 Questions
Exam 8: Application the Cost of Taxation: The Determinants of the Deadweight Loss61 Questions
Exam 8: Application the Cost of Taxation: Deadweight Loss and Tax Revenue As Taxes Vary62 Questions
Exam 8: Application the Cost of Taxation: Conclusion2 Questions
Exam 8: Application the Cost of Taxation: Part A58 Questions
Exam 8: Application the Cost of Taxation: Part B59 Questions
Exam 9: Application International Trade2 Questions
Exam 9: Application International Trade: The Determinants of Trade41 Questions
Exam 9: Application International Trade: The Winners and Losers From Trade302 Questions
Exam 9: Application International Trade: The Arguments for Restricting Trade40 Questions
Exam 9: Application International Trade: Conclusion3 Questions
Exam 9: Application International Trade: Part A53 Questions
Exam 9: Application International Trade: Part B68 Questions
Exam 10: Measuring a Nations Income6 Questions
Exam 10: Measuring a Nations Income: The Economy's Income and Expenditure27 Questions
Exam 10: Measuring a Nations Income: The Measurement of GDP117 Questions
Exam 10: Measuring a Nations Income: The Components of GDP106 Questions
Exam 10: Measuring a Nations Income: Real Versus Nominal GDP52 Questions
Exam 10: Measuring a Nations Income: Is GDP a Good Measure of Economic Well-Being22 Questions
Exam 10: Measuring a Nations Income: Part A44 Questions
Exam 10: Measuring a Nations Income: Part B86 Questions
Exam 11: Measuring the Cost of Living12 Questions
Exam 11: Measuring the Cost of Living: The Consumer Price Index195 Questions
Exam 11: Measuring the Cost of Living: Correcting Economic Variables for the Effects of Inflation124 Questions
Exam 11: Measuring the Cost of Living: Part A39 Questions
Exam 11: Measuring the Cost of Living: Part B83 Questions
Exam 12: Production and Growth16 Questions
Exam 12: Production and Growth: Economic Growth Around the World54 Questions
Exam 12: Production and Growth: Productivity Its Role and Determinants159 Questions
Exam 12: Production and Growth: Economic Growth and Public Policy157 Questions
Exam 12: Production and Growth: Conclusion the Importance of Long-Run Growth2 Questions
Exam 12: Production and Growth: Part A59 Questions
Exam 12: Production and Growth: Part B62 Questions
Exam 13: Saving Investment and the Financial System8 Questions
Exam 13: Saving Investment and the Financial System: Financial Institutions in the US economy177 Questions
Exam 13: Saving Investment and the Financial System: Saving and Investment in the National Income Accounts98 Questions
Exam 13: Saving Investment and the Financial System: The Market for Loanable Funds201 Questions
Exam 13: Saving Investment and the Financial System: Part A57 Questions
Exam 13: Saving Investment and the Financial System: Part B63 Questions
Exam 14: The Basic Tools of Finance2 Questions
Exam 14: The Basic Tools of Finance: Present Value Measuring the Time Value of Money213 Questions
Exam 14: The Basic Tools of Finance: Managing Risk120 Questions
Exam 14: The Basic Tools of Finance: Asset Valuation70 Questions
Exam 14: The Basic Tools of Finance: Conclusion2 Questions
Exam 14: The Basic Tools of Finance: Part A59 Questions
Exam 14: The Basic Tools of Finance: Part B54 Questions
Exam 15: Unemployment15 Questions
Exam 15: Unemployment: Identifying Unemployment163 Questions
Exam 15: Unemployment: Job Search40 Questions
Exam 15: Unemployment: Minimum-Wage Laws39 Questions
Exam 15: Unemployment: Unions and Collective Bargaining49 Questions
Exam 15: Unemployment: The Theory of Efficiency Wages41 Questions
Exam 15: Unemployment: Part A48 Questions
Exam 15: Unemployment: Part B221 Questions
Exam 16: The Monetary System17 Questions
Exam 16: The Monetary System: The Meaning of Money100 Questions
Exam 16: The Monetary System: The Federal Reserve System52 Questions
Exam 16: The Monetary System: Banks and the Money Supply78 Questions
Exam 16: The Monetary System: The Feds Tools of Monetary Control126 Questions
Exam 16: The Monetary System: Part A64 Questions
Exam 16: The Monetary System: Part B57 Questions
Exam 17: Money Growth and Inflation22 Questions
Exam 17: Money Growth and Inflation: The Classical Theory of Inflation245 Questions
Exam 17: Money Growth and Inflation: The Costs of Inflation94 Questions
Exam 17: Money Growth and Inflation: Conclusion3 Questions
Exam 17: Money Growth and Inflation: Part A63 Questions
Exam 17: Money Growth and Inflation: Part B60 Questions
Exam 18: Open Economy Macroeconomics Basic Concepts2 Questions
Exam 18: Open Economy Macroeconomics Basic Concepts: The International Flows of Goods and Capital227 Questions
Exam 18: Open Economy Macroeconomics Basic Concepts: The Prices for International Transactions Real and Nominal Exchange Rates76 Questions
Exam 18: Open Economy Macroeconomics Basic Concepts: A First Theory of Exchange-Rate Determination Purchasing-Power Parity87 Questions
Exam 18: Open Economy Macroeconomics Basic Concepts: Part A67 Questions
Exam 18: Open Economy Macroeconomics Basic Concepts: Part B63 Questions
Exam 19: A Macroeconomic Theory of the Open Economy3 Questions
Exam 19: A Macroeconomic Theory of the Open Economy: Supply and Demand for Loanable Funds and for Foreign-Currency Exchange141 Questions
Exam 19: A Macroeconomic Theory of the Open Economy: Equilibrium in the Open Economy45 Questions
Exam 19: A Macroeconomic Theory of the Open Economy: How Policies and Events Affect an Open Economy172 Questions
Exam 19: A Macroeconomic Theory of the Open Economy: Part A47 Questions
Exam 19: A Macroeconomic Theory of the Open Economy: Part B56 Questions
Exam 20: Aggregate Demand and Aggregate Supply6 Questions
Exam 20: Aggregate Demand and Aggregate Supply: Three Key Facts About Economic Fluctuations33 Questions
Exam 20: Aggregate Demand and Aggregate Supply: Explaining Short-Run Economic Fluctuations38 Questions
Exam 20: Aggregate Demand and Aggregate Supply: The Aggregate-Demand Curve141 Questions
Exam 20: Aggregate Demand and Aggregate Supply: The Aggregate-Supply Curve95 Questions
Exam 20: Aggregate Demand and Aggregate Supply: Two Causes of Economic Fluctuations117 Questions
Exam 20: Aggregate Demand and Aggregate Supply: Part A59 Questions
Exam 20: Aggregate Demand and Aggregate Supply: Part B61 Questions
Exam 21: The Influences of Monetary and Fiscal Policy on Aggregate Demand5 Questions
Exam 21: The Influences of Monetary and Fiscal Policy on Aggregate Demand: How Monetary Policy Influences Aggregate Demand198 Questions
Exam 21: The Influences of Monetary and Fiscal Policy on Aggregate Demand: How Fiscal Policy Influences Aggregate Demand123 Questions
Exam 21: The Influences of Monetary and Fiscal Policy on Aggregate Demand: Using Policy to Stabilize the Economy73 Questions
Exam 21: The Influences of Monetary and Fiscal Policy on Aggregate Demand: Part A60 Questions
Exam 21: The Influences of Monetary and Fiscal Policy on Aggregate Demand: Part B50 Questions
Exam 22: The Short Run Trade Off Between Inflation and Unemployment11 Questions
Exam 22: The Short Run Trade Off Between Inflation and Unemployment: The Phillips Curve86 Questions
Exam 22: The Short Run Trade Off Between Inflation and Unemployment: Shifts in the Phillips Curve the Role of Expectations161 Questions
Exam 22: The Short Run Trade Off Between Inflation and Unemployment: Shifts in the Phillips Curve the Role of Supply Shocks60 Questions
Exam 22: The Short Run Trade Off Between Inflation and Unemployment: The Cost of Reducing Inflation87 Questions
Exam 22: The Short Run Trade Off Between Inflation and Unemployment: Part A62 Questions
Exam 22: The Short Run Trade Off Between Inflation and Unemployment: Part B52 Questions
Exam 23: Six Debates Over Macroeconomic Policy: Should Monetary and Fiscal Policymakers Try to Stabilize the Economy44 Questions
Exam 23: Six Debates Over Macroeconomic Policy: Should the Government Fight Recessions With Spending Hikes Rather Than Tax Cuts15 Questions
Exam 23: Six Debates Over Macroeconomic Policy: Should Monetary Policy Be Made by Rule Rather Than by Discretion37 Questions
Exam 23: Six Debates Over Macroeconomic Policy: Should the Central Bank Aim for Zero Inflation49 Questions
Exam 23: Six Debates Over Macroeconomic Policy: Should the Government Balance Its Budget38 Questions
Exam 23: Six Debates Over Macroeconomic Policy: Should the Tax Laws Be Reformed to Encourage Saving44 Questions
Exam 23: Six Debates Over Macroeconomic Policy: Conclusion1 Questions
Exam 23: Six Debates Over Macroeconomic Policy: Part A68 Questions
Exam 23: Six Debates Over Macroeconomic Policy: Part B39 Questions
Exam 24: A-Financial-Overview-Of-The-US104 Questions
Select questions type
If taxes rise,then aggregate demand shifts
Free
(Multiple Choice)
4.8/5  (34)
(34)
Correct Answer: Verified
C
Figure 35-3.The left-hand graph shows a short-run aggregate-supply (SRAS)curve and two aggregate-demand (AD)curves.On the left-hand diagram,Y represents output and on the right-hand diagram,U represents the unemployment rate. 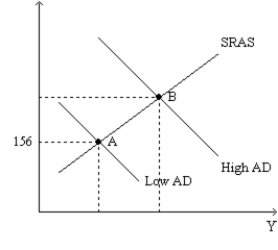
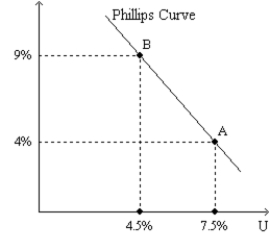 -Refer to Figure 35-3.What is measured along the vertical axis of the right-hand graph?
Free
(Multiple Choice)
4.7/5 (36)
Correct Answer:Verified
B
Samuelson and Solow argued that
Free
(Multiple Choice)
4.8/5 (30)
Correct Answer:Verified
B
Figure 35-4.The left-hand graph shows a short-run aggregate-supply (SRAS)curve and two aggregate-demand (AD)curves.On the left-hand diagram,the price level is measured on the vertical axis;on the right-hand diagram,the inflation rate is measured on the vertical axis. 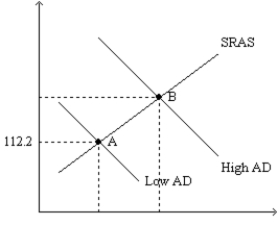
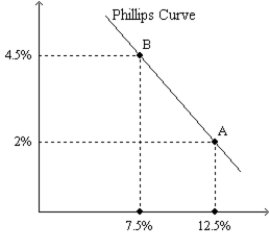 -Refer to Figure 35-4.What is measured along the horizontal axis of the right-hand graph?
(Multiple Choice)
4.8/5 (36)
The economist A.W.Phillips published a famous article in 1958 in which he showed a
(Multiple Choice)
4.9/5 (37)
In 2009 Congress and President Obama approved tax cuts and increased government spending.According to the short-run Phillips curve these policies should have
(Multiple Choice)
4.8/5 (29)
In his famous article published in an economics journal in 1958,A.W.Phillips
(Multiple Choice)
4.8/5 (36)
Figure 35-2
Use the pair of diagrams below to answer the following questions. 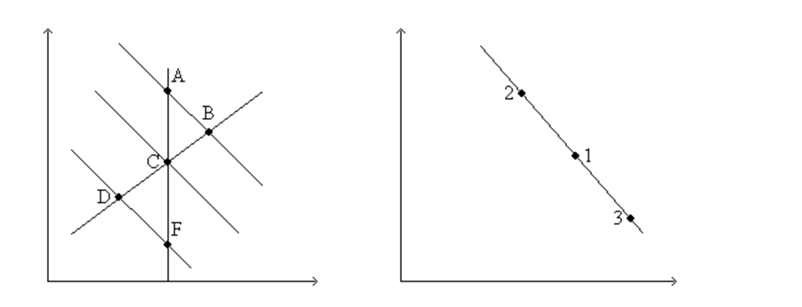 -Refer to Figure 35-2.If the economy starts at C and 1,then in the short run,a decrease in aggregate demand moves the economy to
(Multiple Choice)
4.9/5 (32)
According to the short-run Phillips curve,if the central bank increases the money supply,then
(Multiple Choice)
4.9/5 (40)
During the financial crisis Congress and President Obama authorized tax cuts and increases in government spending.According to the Phillips curve,in the short run these policies should have
(Multiple Choice)
4.8/5 (26)
Figure 35-2
Use the pair of diagrams below to answer the following questions.
-Refer to Figure 35-2.If the economy starts at C and 1,then in the short run,an increase in government expenditures moves the economy to
(Multiple Choice)
4.8/5 (27)
Samuelson and Solow argued that when unemployment is high,there is
(Multiple Choice)
4.7/5 (30)
Figure 35-1.The left-hand graph shows a short-run aggregate-supply (SRAS)curve and two aggregate-demand (AD)curves.On the right-hand diagram,U represents the unemployment rate. 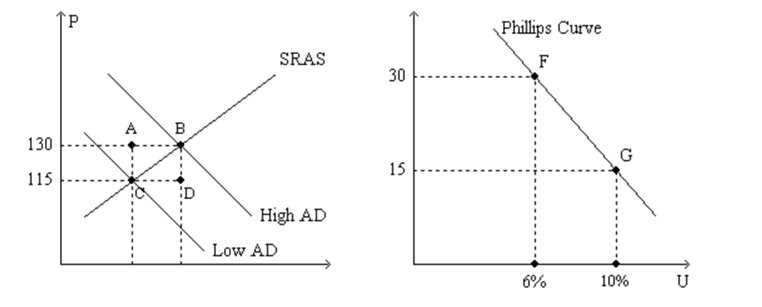 -Refer to Figure 35-1.The curve that is depicted on the right-hand graph offers policymakers a "menu" of combinations
(Multiple Choice)
4.9/5 (35)
According to the Phillips curve,policymakers can reduce inflation by
(Multiple Choice)
4.9/5 (33)
Economist A.W.Phillips found a negative correlation between
(Multiple Choice)
4.9/5 (33)
Filters
- Essay(0)
- Multiple Choice(0)
- Short Answer(0)
- True False(0)
- Matching(0)