Exam 9: Derivatives
Exam 1: Linear Equations and Functions245 Questions
Exam 2: Quadratic and Other Special Functions120 Questions
Exam 3: Matrices230 Questions
Exam 4: Inequalities and Linear Programming119 Questions
Exam 5: Exponential and Logarithmic Functions109 Questions
Exam 6: Mathematics of Finance131 Questions
Exam 7: Introduction to Probability180 Questions
Exam 8: Further Topics in Probability and Data Description114 Questions
Exam 9: Derivatives249 Questions
Exam 10: Derivatives172 Questions
Exam 11: Derivatives Continued139 Questions
Exam 12: Indefinite Integrals120 Questions
Exam 13: Definite Integrals - Techniques370 Questions
Exam 13: A: Definite Integrals - Techniques370 Questions
Exam 14: Functions of Two or More Variables122 Questions
Exam 15: Algebraic Concepts 240 Questions
Exam 15: Algebraic Concepts 374 Questions
Exam 15: Algebraic Concepts 496 Questions
Exam 15: Algebraic Concepts 599 Questions
Select questions type
Find the derivative of the given function. Simplify and express the answer using positive exponents only. 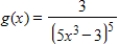
Free
(Multiple Choice)
4.9/5  (30)
(30)
Correct Answer: Verified
A
Find the indicated derivative. Find 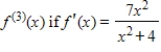 .
.
Free
(Multiple Choice)
4.8/5 (36)
Correct Answer:Verified
B
The total revenue function (in dollars) for a blender is 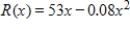 , where x is the number of units sold. What is the average rate of change in revenue R(x) as x increases from 20 to 30 units?
(Multiple Choice)
4.8/5 (33)
Find the derivative of the given function. Simplify and express the answer using positive exponents only. 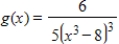
(Multiple Choice)
4.9/5 (33)
For the function in this problem, approximate  near
near  by graphing the function on a graphing utility. Then, zoom in near the point until the graph appears straight, pick two points, and find the slope of the line you see. Round your answer to four decimal places.
(Multiple Choice)
4.9/5 (30)
Find the derivative of the given function. Simplify and express the answer using positive exponents only. 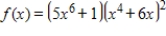
(Multiple Choice)
4.8/5 (36)
Find the derivative of the equation 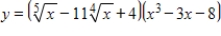 , but do not simplify your answer.
(Multiple Choice)
4.8/5 (36)
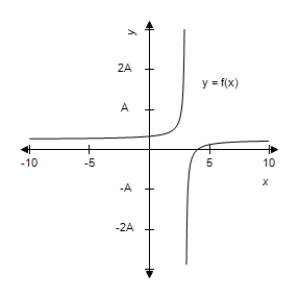
This problem contains a function and its graph, where  . Use the graph to determine, as well as you can,
  . Check your conclusion by using the function to determine
  analytically.
(Multiple Choice)
4.7/5 (27)
Suppose that for selected years from 1970 to 2006, the following table shows the percent of total U.S. workers who are female.
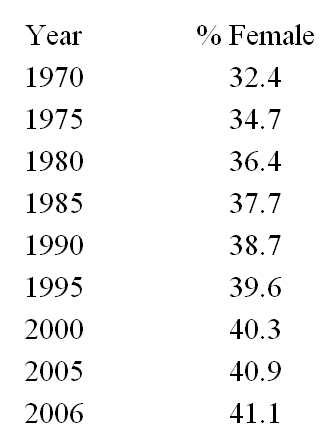
Assume these data can be modeled with the function
Assume these data can be modeled with the function 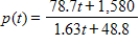 where p(t) is the percent of the U.S. workforce that is female and t is the number of years past 1970. Find the instantaneous rate of change in 2000 and 2006 by using the function that models the instantaneous rate of change of the percent of U.S. workers who are female. Round your answer to three decimal places.
(Multiple Choice)
4.9/5 (36)
Suppose the lowest temperature recorded in Indianapolis, Indiana, was  If x is the wind speed in miles per hour and
  , then the wind chill (in degrees Fahrenheit) for an air temperature of
  can be approximated by the function
 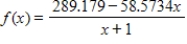 . At what rate is the wind chill changing when the wind speed is 50 mph? Round your answer to two decimal places.
(Multiple Choice)
4.8/5 (30)
For the function in this problem, approximate  by using the numerical derivative feature of a graphing utility. Round your answer to three decimal places.
(Multiple Choice)
4.8/5 (33)
The daily sales S (in thousands of dollars) that are attributed to an advertising campaign are given by 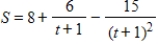 where t is the number of weeks the campaign runs. Find the rate of change of sales at any time t and use the second derivative to find how this rate is changing at
  . Round your answer to four decimal places, when applicable.
(Multiple Choice)
4.8/5 (36)
Find the derivative at the given x-value with the appropriate rule. 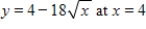
(Multiple Choice)
4.8/5 (32)
The graph of a company's total cost function is shown. Will the 201st item or the 501st item cost more to produce? 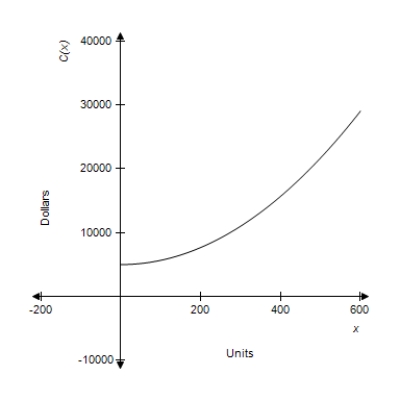
(Multiple Choice)
4.8/5 (37)
Find the coordinates of points where the graph of  has horizontal tangents. As a check, graph
  and see whether the points you found look as though they have horizontal tangents.
(Multiple Choice)
4.9/5 (41)
Filters
- Essay(0)
- Multiple Choice(0)
- Short Answer(0)
- True False(0)
- Matching(0)