Exam 7: The Labor Market, Wages, and Unemployment
Exam 1: Introduction to Macroeconomics35 Questions
Exam 2: Measuring the Macroeconomy111 Questions
Exam 3: An Overview of Long-Run Economic Growth106 Questions
Exam 4: A Model of Production128 Questions
Exam 5: The Solow Growth Model125 Questions
Exam 6: Growth and Ideas114 Questions
Exam 7: The Labor Market, Wages, and Unemployment114 Questions
Exam 8: Inflation111 Questions
Exam 9: An Introduction to the Short Run105 Questions
Exam 10: The Great Recession: a First Look104 Questions
Exam 11: The Is Curve122 Questions
Exam 12: Monetary Policy and the Phillips Curve132 Questions
Exam 13: Stabilization Policy and the Asad Framework109 Questions
Exam 14: The Great Recession and the Short-Run Model104 Questions
Exam 15: Dsge Models: the Frontier of Business Cycle Research114 Questions
Exam 16: Consumption104 Questions
Exam 17: Investment111 Questions
Exam 18: The Government and the Macroeconomy115 Questions
Exam 19: International Trade103 Questions
Exam 20: Exchange Rates and International Finance129 Questions
Exam 21: Parting Thoughts35 Questions
Select questions type
Refer to the following figure when answering
Figure 7.3: Labor Market 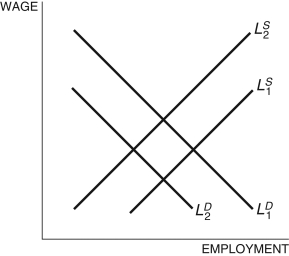 -In the labor market depicted in Figure 7.3, investment in new physical capital:
Free
(Multiple Choice)
4.7/5  (28)
(28)
Correct Answer: Verified
D
Refer to the following table when answering
Table 7.2
Separation rate Finding rate Labor force 2015 2\% 20\% 130 2016 2.5\% 15\% 100
-Consider the data in Table 7.2. In ________ the natural rate of unemployment was the higher of the two years at ________ percent.
Free
(Multiple Choice)
4.8/5 (31)
Correct Answer:Verified
A
If the income taxes on wages increase, the labor supply curve will shift left, but what happens to the unemployment rate?
Free
(Multiple Choice)
4.8/5 (27)
Correct Answer:Verified
D
Unemployment is given by ________ and the natural rate of unemployment is ________.
(Multiple Choice)
4.9/5 (24)
Since the end of World War II, the percentage of women in the workforce has been falling.
(True/False)
4.8/5 (35)
Cyclical unemployment is the unemployment that results from:
(Multiple Choice)
4.7/5 (39)
Refer to the following table when answering
Table 7.2
Separation rate Finding rate Labor force 2015 2\% 20\% 130 2016 2.5\% 15\% 100
-Consider the data in Table 7.2. Using the "bathtub model" of unemployment, in 2016 the natural rate of unemployment is:
(Multiple Choice)
4.8/5 (33)
The supply of labor curve slopes upward because, with a higher wage, the opportunity cost of leisure rises.
(True/False)
4.7/5 (33)
In the "bathtub model" of unemployment, the job finding rate equals the job separation rate.
(True/False)
4.9/5 (38)
You win the lottery, which pays $1 million in 20 annual $50,000 payments. Your friends ask how much that would be if you received a single lump sum payment today. You do not have your calculator, but you show them the following equation to help them solve it themselves, assuming the interest rate is 10 percent:
(Multiple Choice)
4.7/5 (39)
Refer to the following figure when answering
Figure 7.4: Labor Market 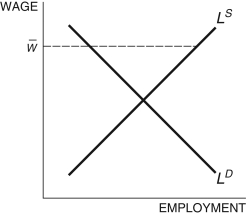 -Consider the labor market depicted in Figure 7.4. Wage, , is called ________ and ________ unemployment.
(Multiple Choice)
4.8/5 (38)
The average unemployment benefit of an American worker is about $300 per week and lasts 26 weeks.
(True/False)
4.8/5 (37)
When a firm purchases more capital, ceteris paribus, the demand for labor will fall.
(True/False)
4.9/5 (43)
Refer to the following figure when answering
Figure 7.3: Labor Market
-In the labor market depicted in Figure 7.3, an increase in the income tax would result in:
(Multiple Choice)
4.9/5 (35)
One explanation for the college wage premium is that demand for skill-based knowledge is rising.
(True/False)
4.9/5 (32)
Refer to the following figure when answering
Figure 7.5: Labor Market 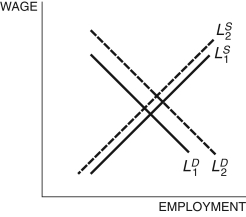 -Consider Figure 7.5. Given what we know about the number of hours worked by college graduates and the wage premium received by college graduates, which equilibrium in the figure characterizes these empirical observations, on average?
(Multiple Choice)
4.8/5 (31)
Filters
- Essay(0)
- Multiple Choice(0)
- Short Answer(0)
- True False(0)
- Matching(0)