Exam 5: The Solow Growth Model
Exam 1: Introduction to Macroeconomics35 Questions
Exam 2: Measuring the Macroeconomy111 Questions
Exam 3: An Overview of Long-Run Economic Growth106 Questions
Exam 4: A Model of Production128 Questions
Exam 5: The Solow Growth Model125 Questions
Exam 6: Growth and Ideas114 Questions
Exam 7: The Labor Market, Wages, and Unemployment114 Questions
Exam 8: Inflation111 Questions
Exam 9: An Introduction to the Short Run105 Questions
Exam 10: The Great Recession: a First Look104 Questions
Exam 11: The Is Curve122 Questions
Exam 12: Monetary Policy and the Phillips Curve132 Questions
Exam 13: Stabilization Policy and the Asad Framework109 Questions
Exam 14: The Great Recession and the Short-Run Model104 Questions
Exam 15: Dsge Models: the Frontier of Business Cycle Research114 Questions
Exam 16: Consumption104 Questions
Exam 17: Investment111 Questions
Exam 18: The Government and the Macroeconomy115 Questions
Exam 19: International Trade103 Questions
Exam 20: Exchange Rates and International Finance129 Questions
Exam 21: Parting Thoughts35 Questions
Select questions type
Refer to the following figure when answering
Figure 5.1: Solow Diagram 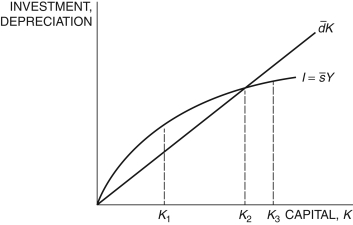 -In Figure 5.1, if the economy begins with the initial capital stock at K1, the capital stock will ________ and the economy will ________.
Free
(Multiple Choice)
4.7/5  (34)
(34)
Correct Answer: Verified
B
In the Solow model, if investment is ________ depreciation, the capital stock ________.
Free
(Multiple Choice)
4.7/5 (37)
Correct Answer:Verified
B
Refer to the following figure when answering
Figure 5.2 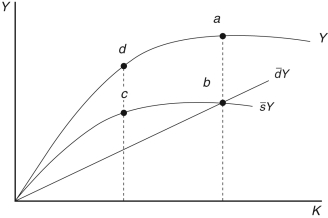 -In Figure 5.2, steady state investment is represented by:
Free
(Multiple Choice)
4.9/5 (34)
Correct Answer:Verified
A
Assume a production function is given by . If
And
, the depreciation rate is
, and the saving rate is
, the steady-state level of capital is about:
(Multiple Choice)
4.9/5 (32)
In 1960, the Phillipines had a per capita income ________ South Korea. In 2010, ________.
(Multiple Choice)
4.8/5 (30)
Refer to the following figure when answering
Figure 5.5: Solow Diagram 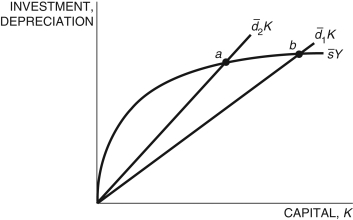 -Consider Figure 5.5, which represents two countries, 1 and 2. Country ________ has a higher depreciation rate and, therefore, has a ________ steady state than the other country.
(Multiple Choice)
4.8/5 (39)
Refer to the following figure when answering
Figure 5.4: Solow Diagram 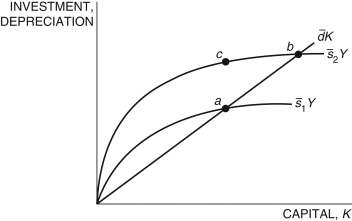 -Consider Figure 5.4, which represents two countries, 1 and 2. Country ________ has a higher saving rate and will have a ________ steady state than the other country.
(Multiple Choice)
4.8/5 (27)
Using the Solow model, if, in time t = 0, the initial capital stock is K0 = 100, investment is I0 = 25, and .1 is the depreciation rate, capital accumulation is:
(Multiple Choice)
4.9/5 (35)
A central lesson of the Solow model is a bit of a surprise:
(Multiple Choice)
4.8/5 (36)
In the Solow model, the parameter denotes ________ and is ________.
(Multiple Choice)
4.9/5 (26)
Refer to the following figure when answering
Figure 5.4: Solow Diagram
-Consider the Solow model exhibited in Figure 5.4.
Which of the following is/are true?
i. For any single country, the movement from point a to b is due to an increase in the saving rate, s1 > s2.
ii. For any single country, the movement from point c to b is due to an increase in capital stock for the saving rate, s2.
iii. If s1 and s2 stands for the saving rates in Countries 1 and 2, respectively, Country 2 has a lower saving rate.
(Multiple Choice)
4.8/5 (30)
Given a production function , if , and :
(a) Calculate the steady-state level of capital and output.
(b) Does the above production function exhibit constant returns to scale, or does it exhibit diminishing marginal returns? Explain, and define the difference between these two concepts.
(Essay)
4.9/5 (33)
In the standard production model, the productivity parameter enters the equation with an exponent of one, while in the Solow model it is greater than one because:
(Multiple Choice)
5.0/5 (27)
Assume a production function is given by . If
And
, and the steady-state capital stock is 8.0, the steady-state level of output is about:
(Multiple Choice)
4.8/5 (41)
Filters
- Essay(0)
- Multiple Choice(0)
- Short Answer(0)
- True False(0)
- Matching(0)