Exam 18: Decision Theory
Exam 1: An Introduction to Business Statistics95 Questions
Exam 2: Descriptive Statistics: Tabular and Graphical Methods85 Questions
Exam 3: Descriptive Statistics: Numerical Methods57 Questions
Exam 4: Probability44 Questions
Exam 5: Discrete Random Variables71 Questions
Exam 6: Continuous Random Variables40 Questions
Exam 7: Sampling and Sampling Distributions52 Questions
Exam 8: Confidence Intervals126 Questions
Exam 9: Hypothesis Testing84 Questions
Exam 10: Statistical Inferences for Means and Proportions70 Questions
Exam 11: Statistical Inferences for Population Variances54 Questions
Exam 12: Experimental Design and Analysis of Variance81 Questions
Exam 13: Chi-Square Tests136 Questions
Exam 14: Simple Linear Regression Analysis95 Questions
Exam 15: Multiple Regression and Model Building119 Questions
Exam 16: Time Series Forecasting and Index Numbers71 Questions
Exam 17: Nonparametric Methods61 Questions
Exam 18: Decision Theory85 Questions
Select questions type
The maximax criterion finds the worst possible payoff for each alternative and then chooses the alternative that yields the maximum of those worst possible payoffs.
Free
(True/False)
4.7/5  (43)
(43)
Correct Answer: Verified
False
Decision makers in business organizations make most decisions in environments that involve some degree of ___________________.
Free
(Multiple Choice)
4.9/5 (31)
Correct Answer:Verified
D
In utility theory,a(n)__________________ decision maker is an individual who will choose the decision alternative having the highest expected profit.
Free
(Multiple Choice)
4.8/5 (31)
Correct Answer:Verified
C
The quality control manager for NKA Inc.must decide whether to accept (alternative 1),further analyze (alternative 2),or reject (alternative 3)an incoming shipment (lot)of microchips.The historical data indicate that there is a 30 percent chance that the lot is poor quality (S1),50 percent chance that the lot is fair quality (S2),and 20 percent chance that the lot is good quality (S3).Assume the following payoff table is available.The values in the payoff table are in thousands of dollars. 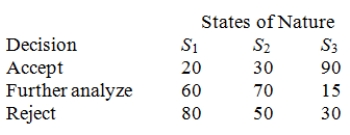 Based on historical data,if the lot is poor quality,40 percent of the items are defective.If the lot is fair quality,22 percent of the items are defective.If the lot is good quality,10 percent of the items are defective.The quality control manager inspects one unit from a recent shipment.After inspecting it,he determines that the unit is not defective.Based on this additional information,determine the revised (posterior)probabilities for each of the three states of nature.
(Essay)
4.8/5 (35)
The quality control manager for NKA Inc.must decide whether to accept (alternative 1),further analyze (alternative 2),or reject (alternative 3)an incoming shipment (lot)of microchips.The historical data indicate that there is a 30 percent chance that the lot is poor quality (S1),50 percent chance that the lot is fair quality (S2),and 20 percent chance that the lot is good quality (S3).Assume the following payoff table is available.The values in the payoff table are in thousands of dollars.  What alternative action should be selected according to the expected monetary value criterion?
(Essay)
4.8/5 (36)
When making a decision in an environment of ________________,the likelihood of each state of nature can be estimated.
(Multiple Choice)
4.8/5 (32)
The ____________________criterion for choosing among alternative actions assumes that the state of nature with the best payoff will be experienced.
(Multiple Choice)
4.8/5 (34)
The maximin criterion is preferred by optimistic decision makers.
(True/False)
4.8/5 (38)
The expected net gain of sampling equals the ____________________ minus the cost of sampling.
(Multiple Choice)
4.9/5 (28)
__________________ statistics is an area of statistics that uses a theorem to update prior belief about a probability or population parameter to a posterior belief.
(Multiple Choice)
4.7/5 (29)
Maximax is a criterion used when making decisions under uncertainty.
(True/False)
4.7/5 (34)
The maximin criterion finds the best possible payoff for each alternative and then chooses the alternative that yields the maximum payoff.
(True/False)
4.8/5 (32)
The expected value criterion is used for decision making under __________________.
(Multiple Choice)
4.8/5 (24)
The maximax criterion is preferred by pessimistic decision makers.
(True/False)
4.7/5 (34)
In utility analysis,a utility curve that shows a rapid increase in utility for initial amounts of money followed by a gradual leveling off for larger amounts of money is appropriate for a risk-seeking decision maker.
(True/False)
4.8/5 (29)
A _______________________ is a diagram that assists the decision maker in analyzing a decision problem.
(Multiple Choice)
4.9/5 (29)
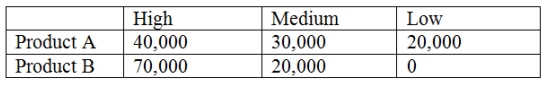
A company wants to add a new product to its existing line of products.There are two similar candidate products,A and B.The demand for the new product could be high,medium,or low,with probabilities of .25,.5,and .25,respectively.The demand and the corresponding profit for each product are shown below.
(Essay)
4.9/5 (37)
Alternatives 1 and 2 in the following payoff table represent the two possible manufacturing strategies that the EKA manufacturing company can adopt.The level of demand affects the success of both strategies.The states of nature (SI)represent the levels of demand for the company products.S1,S2,and S3 characterize high,medium,and low demand,respectively.The payoff values are in thousands of dollars. 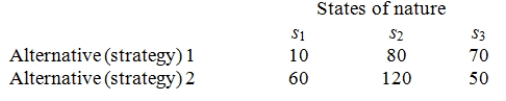 The management believes that weather conditions significantly affect the level of demand.48 monthly sales reports are randomly selected.These monthly sales reports show 15 months with high demand,28 months with medium demand,and 5 months with low demand.12 of the 15 months with high demand had favorable weather conditions.14 of the 28 months with medium demand had favorable weather conditions.Only 1 of the 5 months with low demand had favorable weather conditions.If the weather conditions are favorable,determine which manufacturing strategy the company should implement.
(Essay)
4.7/5 (46)
Alternatives 1 and 2 in the following payoff table represent the two possible manufacturing strategies that the EKA manufacturing company can adopt.The level of demand affects the success of both strategies.The states of nature (SI)represent the levels of demand for the company products.s1,s2,and s3 characterize high,medium,and low demand,respectively.The payoff values are in thousands of dollars.Prior probabilities are .3 for s1;.6 for s2,and .1 for s3. 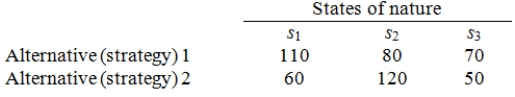 What is the maximum amount that the company would be willing to pay for perfect information?
(Essay)
4.9/5 (45)
Alternatives 1 and 2 in the following payoff table represent the two possible manufacturing strategies that the EKA manufacturing company can adopt.The level of demand affects the success of both strategies.The states of nature (SI)represent the levels of demand for the company products.S1,S2,and S3 characterize high,medium,and low demand,with probabilities of .3,.6,and .1,respectively.The payoff values are in thousands of dollars.  The management believes that weather conditions significantly affect the level of demand.48 monthly sales reports are randomly selected.These monthly sales reports show 15 months with high demand,28 months with medium demand,and 5 months with low demand.12 of the 15 months with high demand had favorable weather conditions.14 of the 28 months with medium demand had favorable weather conditions.Only 1 of the 5 months with low demand had favorable weather conditions.The estimated probabilities of poor weather conditions given different levels of demand are presented below.
  What is the probability of high demand given that the weather conditions are poor?
(Multiple Choice)
5.0/5 (31)
Filters
- Essay(0)
- Multiple Choice(0)
- Short Answer(0)
- True False(0)
- Matching(0)