Exam 18: Decision Theory
Exam 1: An Introduction to Business Statistics95 Questions
Exam 2: Descriptive Statistics: Tabular and Graphical Methods85 Questions
Exam 3: Descriptive Statistics: Numerical Methods57 Questions
Exam 4: Probability44 Questions
Exam 5: Discrete Random Variables71 Questions
Exam 6: Continuous Random Variables40 Questions
Exam 7: Sampling and Sampling Distributions52 Questions
Exam 8: Confidence Intervals126 Questions
Exam 9: Hypothesis Testing84 Questions
Exam 10: Statistical Inferences for Means and Proportions70 Questions
Exam 11: Statistical Inferences for Population Variances54 Questions
Exam 12: Experimental Design and Analysis of Variance81 Questions
Exam 13: Chi-Square Tests136 Questions
Exam 14: Simple Linear Regression Analysis95 Questions
Exam 15: Multiple Regression and Model Building119 Questions
Exam 16: Time Series Forecasting and Index Numbers71 Questions
Exam 17: Nonparametric Methods61 Questions
Exam 18: Decision Theory85 Questions
Select questions type
Alternatives 1 and 2 in the following payoff table represent the two possible manufacturing strategies that the EKA manufacturing company can adopt.The level of demand affects the success of both strategies.The states of nature (SI)represent the levels of demand for the company products.S1,S2,and S3 characterize high,medium,and low demand,respectively.The payoff values are in thousands of dollars. 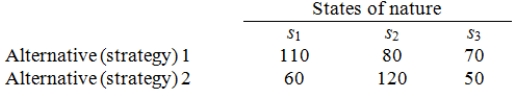 Determine the best alternative (course of action)for the EKA manufacturing company using the maximin criterion.
(Essay)
4.8/5  (39)
(39)
The ____________________criterion for choosing among alternative actions assumes that the state of nature with the worst payoff will be experienced.
(Multiple Choice)
4.8/5 (34)
The utility curve given below represents the preferences of a _________________ decision maker. 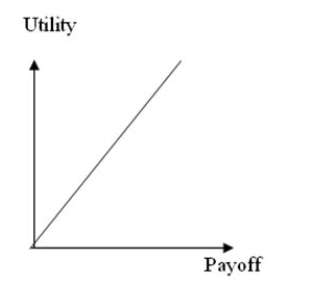
(Multiple Choice)
4.9/5 (44)
The utility curve given below represents the preferences of a _________________ decision maker. 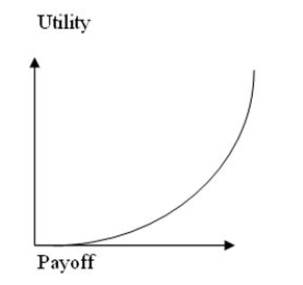
(Multiple Choice)
4.8/5 (39)
Alternatives 1 and 2 in the following payoff table represent the two possible manufacturing strategies that the EKA manufacturing company can adopt.The level of demand affects the success of both strategies.The states of nature (SI)represent the levels of demand for the company products.S1,S2,and S3 characterize high,medium,and low demand,respectively.The payoff values are in thousands of dollars. 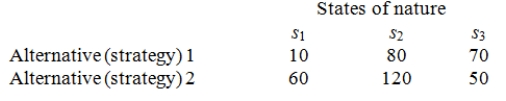 The management believes that weather conditions significantly affect the level of demand.48 monthly sales reports are randomly selected.These monthly sales reports show 15 months with high demand,28 months with medium demand,and 5 months with low demand.12 of the 15 months with high demand had favorable weather conditions.14 of the 28 months with medium demand had favorable weather conditions.Only 1 of the 5 months with low demand had favorable weather conditions.If the weather conditions are poor,determine which manufacturing strategy the company should implement.
(Essay)
4.7/5 (28)
Filters
- Essay(0)
- Multiple Choice(0)
- Short Answer(0)
- True False(0)
- Matching(0)