Exam 2: Descriptive Statistics: Tabular and Graphical Methods
Exam 1: An Introduction to Business Statistics95 Questions
Exam 2: Descriptive Statistics: Tabular and Graphical Methods85 Questions
Exam 3: Descriptive Statistics: Numerical Methods57 Questions
Exam 4: Probability44 Questions
Exam 5: Discrete Random Variables71 Questions
Exam 6: Continuous Random Variables40 Questions
Exam 7: Sampling and Sampling Distributions52 Questions
Exam 8: Confidence Intervals126 Questions
Exam 9: Hypothesis Testing84 Questions
Exam 10: Statistical Inferences for Means and Proportions70 Questions
Exam 11: Statistical Inferences for Population Variances54 Questions
Exam 12: Experimental Design and Analysis of Variance81 Questions
Exam 13: Chi-Square Tests136 Questions
Exam 14: Simple Linear Regression Analysis95 Questions
Exam 15: Multiple Regression and Model Building119 Questions
Exam 16: Time Series Forecasting and Index Numbers71 Questions
Exam 17: Nonparametric Methods61 Questions
Exam 18: Decision Theory85 Questions
Select questions type
Row or column percentages can be found in
Free
(Multiple Choice)
4.8/5  (43)
(43)
Correct Answer: Verified
C
A bullet graph features a single measure as either a horizontal or vertical bar.
Free
(True/False)
4.8/5 (34)
Correct Answer:Verified
True
When constructing any graphical display that utilizes categorical data,classes that have frequencies of 5 percent or less are usually combined together into a single category.
Free
(True/False)
4.8/5 (43)
Correct Answer:Verified
True
Which one of the following graphical tools is used with quantitative data?
(Multiple Choice)
4.8/5 (36)
Recently an advertising company called 200 people and asked them to identify the company that was in an ad running nationwide.They obtained the following results. 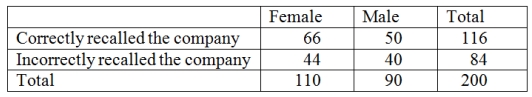 Construct a table of row percentages.
(Essay)
4.8/5 (39)
A local electronics retailer recently conducted a study on purchasers of large screen televisions.The study recorded the type of television and the credit account balance of the customer at the time of purchase.They obtained the following results. 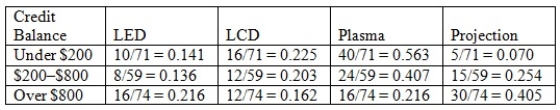 Construct a table of column percentages.
(Essay)
4.7/5 (38)
Leaves on a stem-and-leaf display should be rearranged so that they are in increasing order from left to right.
(True/False)
4.9/5 (30)
Which of the following graphical tools is not used to study the shapes of distributions?
(Multiple Choice)
4.8/5 (33)
The following is a relative frequency distribution of grades in an introductory statistics course. 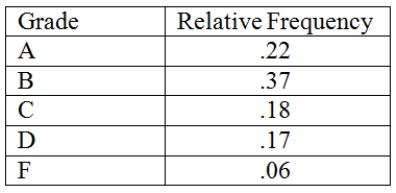 If we wish to depict these data using a pie chart,find how many degrees (out of 360 degrees)should be assigned to each grade.
(Essay)
4.8/5 (36)
A flaw possessed by a population or sample unit is ___________.
(Multiple Choice)
4.7/5 (36)
The number of items rejected daily by a manufacturer because of defects for the last 30 days are:
20,21,8,17,22,19,18,19,14,17,11,6,21,25,4,19,9,12,16,16,10,28,24,6,21,20,25,5,17,8
Construct an ogive plot.
(Essay)
4.7/5 (27)
As a business owner,I have requested my staff to develop a set of dashboards that can be used by the public to show wait time at each of my four local coffee shops at peak times during the day and whether the time is short,medium,or long.Which of the following graphical displays would be the best choice?
(Multiple Choice)
4.8/5 (37)
If there are 120 values in a data set,how many classes should be created for a frequency histogram?
(Multiple Choice)
4.8/5 (31)
The following table lists the types of customer complaint calls on satellite TV service during the first two months after installation. 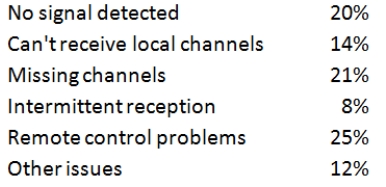 Construct a Pareto chart.
(Essay)
4.7/5 (45)
A(n)_____________ is a graphical presentation of the current status and historical trends of a business's key performance indicators.
(Multiple Choice)
4.9/5 (31)
Which of the following is not a graphical tool for descriptive analytics (dashboards)?
(Multiple Choice)
4.8/5 (36)
A _____________ displays the frequency of each group with qualitative data and a _____________ displays the frequency of each group with quantitative data.
(Multiple Choice)
4.9/5 (34)
Filters
- Essay(0)
- Multiple Choice(0)
- Short Answer(0)
- True False(0)
- Matching(0)