Exam 13: Chi-Square Tests
Exam 1: An Introduction to Business Statistics95 Questions
Exam 2: Descriptive Statistics: Tabular and Graphical Methods85 Questions
Exam 3: Descriptive Statistics: Numerical Methods57 Questions
Exam 4: Probability44 Questions
Exam 5: Discrete Random Variables71 Questions
Exam 6: Continuous Random Variables40 Questions
Exam 7: Sampling and Sampling Distributions52 Questions
Exam 8: Confidence Intervals126 Questions
Exam 9: Hypothesis Testing84 Questions
Exam 10: Statistical Inferences for Means and Proportions70 Questions
Exam 11: Statistical Inferences for Population Variances54 Questions
Exam 12: Experimental Design and Analysis of Variance81 Questions
Exam 13: Chi-Square Tests136 Questions
Exam 14: Simple Linear Regression Analysis95 Questions
Exam 15: Multiple Regression and Model Building119 Questions
Exam 16: Time Series Forecasting and Index Numbers71 Questions
Exam 17: Nonparametric Methods61 Questions
Exam 18: Decision Theory85 Questions
Select questions type
Regression analysis.  A local grocery store wants to predict its daily sales in dollars.The manager believes that the amount of newspaper advertising significantly affects sales.He randomly selects 7 days of data consisting of daily grocery store sales (in thousands of dollars)and advertising expenditures (in thousands of dollars).The Excel/MegaStat output given above summarizes the results of the regression model.Determine a 95 percent confidence interval estimate of the daily average store sales based on $3,000 advertising expenditures.The distance value for this particular prediction is reported as .164.
Free
(Essay)
4.9/5  (45)
(45)
Correct Answer: Verified
[$71,313,$95,353]
Predicted value of y at x = 3000 is 83.333;use t.05/2,df = 5 = 2.571;std error given (83.333 ± (2.571)(11.547)(√.164))= 83.333 ± (2.571)(11.547)(.4049)= 83.333 ± 12.020
Any value of the error term in a regression model _____________ any other value of the error term.
Free
(Multiple Choice)
4.8/5 (37)
Correct Answer:Verified
C
A data set with 7 observations yielded the following.Use the simple linear regression model.  Calculate the correlation coefficient.
Free
(Essay)
4.7/5 (31)
Correct Answer:Verified
r = .987 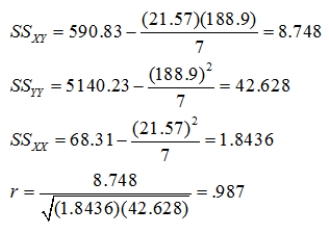
Consider the following partial computer output from a simple linear regression analysis.  Write the equation of the least squares line.
(Short Answer)
4.7/5 (32)
Consider the following partial computer output from a simple linear regression analysis. 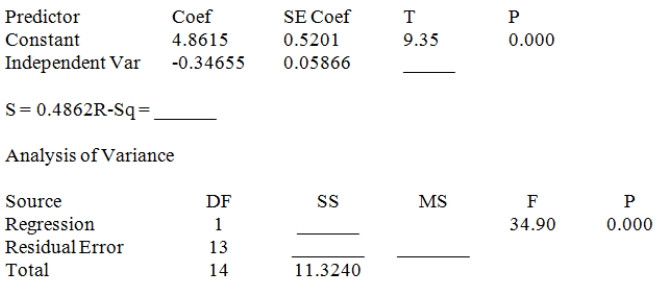 Test H0: β1 = 0 versus Ha: β1 ≠ 0 by setting α = .001.What do you conclude about the relationship between y and x?
(Essay)
4.9/5 (38)
The _____________ is the range of the previously observed values of x.
(Multiple Choice)
4.8/5 (32)
In a simple linear regression model,the coefficient of determination not only indicates the strength of the relationship between the independent and dependent variables,but also shows whether the relationship is positive or negative.
(True/False)
4.9/5 (33)
An experiment was performed on a certain metal to determine if the strength is a function of heating time.The simple linear regression equation is
= 1 + 1X.The time is in minutes and the strength is measured in pounds per square inch.The 95 percent confidence interval for the slope is from .564 to 1.436.Can we reject β1 = 0?
(Essay)
4.7/5 (34)
If r = −1,then we can conclude that there is a perfect relationship between X and Y.
(True/False)
4.8/5 (23)
A data set with 7 observations yielded the following.Use the simple linear regression model. 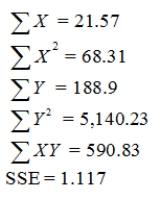 Calculate the standard error.
(Essay)
4.8/5 (36)
An experiment was performed on a certain metal to determine if the strength is a function of heating time.The simple linear regression equation is
= 1 + 1X,and the sample coefficient of determination (r2)= .7777.The time is in minutes and the strength is measured in pounds per square inch.Test to determine if there is a significant correlation between the heating time and strength of the metal.Using H0: ρ = 0 vs.HA: ρ ≠ 0 at α = .05,determine the test statistic and decision.
(Essay)
4.9/5 (27)
In simple regression analysis,r2 is a percentage measure and measures the proportion of the variation explained by the simple linear regression model.
(True/False)
4.9/5 (24)
An experiment was performed on a certain metal to determine if the strength is a function of heating time.Results based on 10 metal sheets are given below.Use the simple linear regression model.  Find the t statistic and test H0: b1 ≤ 0 vs.Ha: b1 > 0 at α = .05.
(Essay)
4.9/5 (33)
Consider the following partial computer output from a simple linear regression analysis. 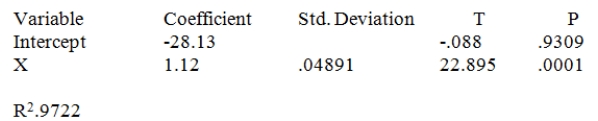 What is the estimated slope?
(Short Answer)
4.9/5 (29)
A simple linear regression model is an equation that describes the straight-line relationship between a dependent variable and an independent variable.
(True/False)
4.9/5 (30)
The slope of the simple linear regression equation represents the average change in the value of the dependent variable per unit change in the independent variable (X).
(True/False)
4.7/5 (29)
An experiment was performed on a certain metal to determine if the strength is a function of heating time.Results based on 10 metal sheets are given below.Use the simple linear regression model. 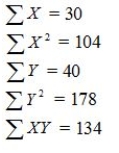 Calculate the correlation coefficient.
(Essay)
4.7/5 (34)
Regression Analysis 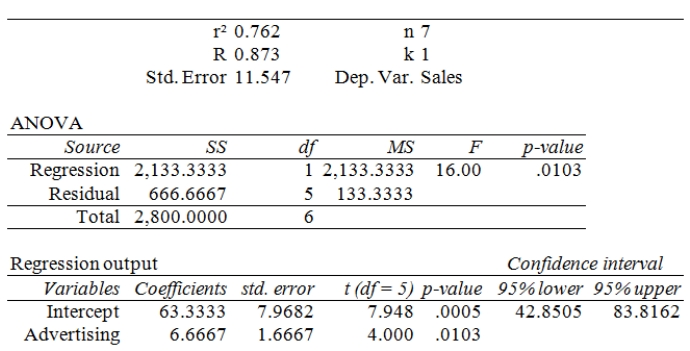 A local grocery store wants to predict its daily sales in dollars.The manager believes that the amount of newspaper advertising significantly affects sales.He randomly selects 7 days of data consisting of daily grocery store sales (in thousands of dollars)and advertising expenditures (in thousands of dollars).The Excel/MegaStat output given above summarizes the results of the regression model.
(Essay)
4.8/5 (39)
A local tire dealer wants to predict the number of tires sold each month.He believes that the number of tires sold is a linear function of the amount of money invested in advertising.He randomly selects 6 months of data consisting of monthly tire sales (in thousands of tires)and monthly advertising expenditures (in thousands of dollars).The simple linear regression equation is ŷ = 3 + 1x,and the sample correlation coefficient (r2)= .6364.Test to determine if there is a significant correlation between the monthly tire sales and monthly advertising expenditures.Use H0: ρ = 0 vs.HA: ρ ≠ 0 at α = .05.
(Essay)
4.9/5 (30)
All of the following are assumptions of the error terms in the simple linear regression model except
(Multiple Choice)
4.9/5 (34)
Filters
- Essay(0)
- Multiple Choice(0)
- Short Answer(0)
- True False(0)
- Matching(0)