Exam 16: Time Series Forecasting and Index Numbers
Exam 1: An Introduction to Business Statistics95 Questions
Exam 2: Descriptive Statistics: Tabular and Graphical Methods85 Questions
Exam 3: Descriptive Statistics: Numerical Methods57 Questions
Exam 4: Probability44 Questions
Exam 5: Discrete Random Variables71 Questions
Exam 6: Continuous Random Variables40 Questions
Exam 7: Sampling and Sampling Distributions52 Questions
Exam 8: Confidence Intervals126 Questions
Exam 9: Hypothesis Testing84 Questions
Exam 10: Statistical Inferences for Means and Proportions70 Questions
Exam 11: Statistical Inferences for Population Variances54 Questions
Exam 12: Experimental Design and Analysis of Variance81 Questions
Exam 13: Chi-Square Tests136 Questions
Exam 14: Simple Linear Regression Analysis95 Questions
Exam 15: Multiple Regression and Model Building119 Questions
Exam 16: Time Series Forecasting and Index Numbers71 Questions
Exam 17: Nonparametric Methods61 Questions
Exam 18: Decision Theory85 Questions
Select questions type
If a process is stable and in statistical control,it is not influenced by assignable causes of variation.
(True/False)
4.9/5  (35)
(35)
A control chart on which subgroup ranges are plotted versus time is a(n)_____ chart.
(Multiple Choice)
4.9/5 (35)
For a given control chart,zone boundaries consist of the UCL and LCL.
(True/False)
4.9/5 (38)
If  = 2.0144,
 = .0972,and there are 25 subgroups of size 5,find the UCL and the LCL for the Chart.
(Multiple Choice)
4.9/5 (40)
Use this information about 10 shipments of lightbulbs.Shipment 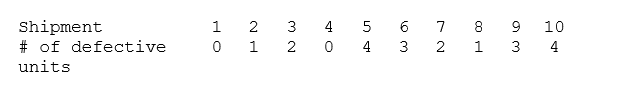 If 400 bulbs are selected at random from each of 10 shipments and the number of defectives in each shipment is given above,find the appropriate center line.
(Multiple Choice)
4.8/5 (26)
Common causes of variation represent the inherent variability of a given process.
(True/False)
4.9/5 (27)
How well a process is able to meet the requirements set forth by the process design is called the quality of design.
(True/False)
4.8/5 (39)
___________ causes of variation may be remedied by local supervision.
(Multiple Choice)
4.9/5 (32)
Assume that 25 samples of 50 each are taken and the total number of defectives is 34.Calculate .
(Multiple Choice)
4.7/5 (27)
If = 16.1,
 = .03,and n = 6,calculate the natural tolerance limits.
(Multiple Choice)
4.9/5 (37)
If a control chart is used correctly and the necessary corrective actions are taken,then as the control limits get close to each other,the potential quality of the product _____________.
(Multiple Choice)
4.7/5 (40)
Filters
- Essay(0)
- Multiple Choice(0)
- Short Answer(0)
- True False(0)
- Matching(0)