Exam 31: Reading,understanding,and Creating Graphs
Exam 1: The Central Idea154 Questions
Exam 2: Observing and Explaining the Economy107 Questions
Exam 3: The Supply and Demand Model170 Questions
Exam 4: Subtleties of the Supply and Demand Model: Price Floors,price Ceilings,and Elasticity181 Questions
Exam 5: The Demand Curve and the Behavior of Consumers136 Questions
Exam 6: The Supply Curve and the Behavior of Firms182 Questions
Exam 7: The Interaction of People in Markets158 Questions
Exam 8: Costs and the Changes at Firms Over Time172 Questions
Exam 9: The Rise and Fall of Industries139 Questions
Exam 10: Monopoly183 Questions
Exam 11: Product Differentiation, monopolistic Competition, and Oligopoly169 Questions
Exam 12: Antitrust Policy and Regulation152 Questions
Exam 13: Labor Markets179 Questions
Exam 14: Taxes, transfers, and Income Distribution180 Questions
Exam 15: Public Goods, externalities, and Government Behavior198 Questions
Exam 16: Capital and Financial Markets173 Questions
Exam 17: Macroeconomics: the Big Picture152 Questions
Exam 18: Measuring the Production, income, and Spending of Nations160 Questions
Exam 19: The Spending Allocation Model168 Questions
Exam 20: Unemployment and Employment207 Questions
Exam 21: Productivity and Economic Growth158 Questions
Exam 22: Money and Inflation149 Questions
Exam 23: The Nature and Causes of Economic Fluctuations162 Questions
Exam 24: The Economic Fluctuations Model207 Questions
Exam 25: Using the Economic Fluctuations Model177 Questions
Exam 26: Fiscal Policy137 Questions
Exam 27: Monetary Policy168 Questions
Exam 28: Economic Growth and Globalization162 Questions
Exam 29: International Trade248 Questions
Exam 30: International Finance123 Questions
Exam 31: Reading,understanding,and Creating Graphs34 Questions
Exam 32: Consumer Theory With Indifference Curves39 Questions
Exam 33: Producer Theory With Isoquants19 Questions
Exam 34: Present Discounted Value16 Questions
Exam 35: The Miracle of Compound Growth11 Questions
Exam 36:Deriving the Growth Accounting Formula13 Questions
Exam 37: Deriving the Formula for the Keynesian Multiplier and the Forward-Looking Consumption Model28 Questions
Select questions type
The slope of an inverse relationship
Free
(Multiple Choice)
4.8/5  (34)
(34)
Correct Answer: Verified
C
A curve shows that every time family income increases by $1,spending increases by $.75.This curve would
Free
(Multiple Choice)
4.9/5 (29)
Correct Answer:Verified
A
Graph the relationship between X and Y such that the relationship between X and Y is linear and positive.
(A)On this graph,show what happens to Y if X increases.
(B)Suppose there is a third variable,Z,that causes Y to decrease (for any given value of X)whenever Z increases.Show what happens to the relationship between X and Y.
Free
(Essay)
4.8/5 (28)
Correct Answer:Verified
Line 1 in the figure below shows the linear and positive relationship between X and Y.An increase in X causes a movement from A to B along line 1.The increase in Z causes the shift from line 1 to line 2.Notice that this is the same as saying that the value of Y decreases for any given value of X. 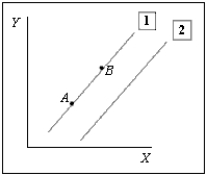
Consider a straight line with a slope of +1 that intersects the origin.It dissects the positive X-Y quadrant.Select any point on the line.What must be true about the distance between the origin and the X coordinate and between the origin and the Y coordinate?
(Short Answer)
4.8/5 (31)
Exhibit 2A-6 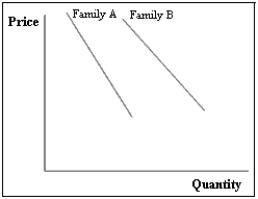 -Exhibit 2A-6 shows the relationship between the price of sodas and the quantities that two families are willing to buy.Suppose that both families are willing to buy more sodas while the soda price remain constant.Which of the following is correct?
(Multiple Choice)
4.9/5 (26)
Exhibit 2A-4 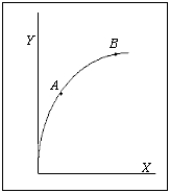 -Refer to Exhibit 2A-4.The slope of the relationship between X and Y is
(Multiple Choice)
4.8/5 (33)
Suppose the value of one variable rises while the value of another variable falls; then the slope of the relationship between the two variables is between 0 and 1.
(True/False)
4.9/5 (37)
Exhibit 2A-7 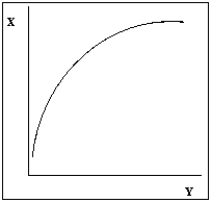 -Exhibit 2A-7 shows the relationship between X and Y.The slope of the relationship is
(Multiple Choice)
4.9/5 (38)
A positive relationship represents a situation where an increase in one variable is associated with an increase in the other variable.Draw three graphs that represent a positive relationship.
(Essay)
4.9/5 (35)
Exhibit 2A-2 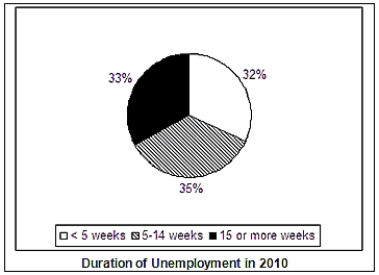 -Suppose in 2010,on average,10 million people were unemployed.According to Exhibit 2A-2,how many of these people had been unemployed for less than five weeks?
(Multiple Choice)
4.8/5 (44)
Refer to the table below,which shows data for the United States. 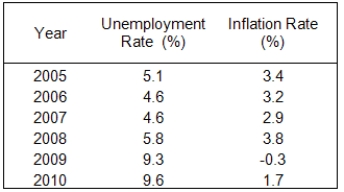 (A)Construct a time-series plot of the unemployment rate.
(B)Construct a time-series plot of the inflation rate.
(C)Construct a scatter plot of the data.Is there any apparent correlation between the inflation rate and the unemployment rate in these data?
(A)Construct a time-series plot of the unemployment rate.
(B)Construct a time-series plot of the inflation rate.
(C)Construct a scatter plot of the data.Is there any apparent correlation between the inflation rate and the unemployment rate in these data?
(Essay)
4.8/5 (27)
Refer to the table below.Analyze the data on the number of meals served at small and large restaurants.The number of meals served will vary with the number of cooks employed at the restaurant. 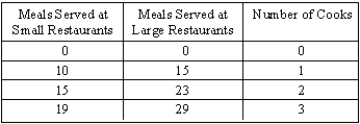 (A)Show the relationship between cooks and meals served by graphing two curves with cooks on the horizontal axis and the number of meals on the vertical axis.How do the slopes of the curves change as more cooks are employed?
(B)Is the change in the number of cooks a shift in the curve or a movement along the curve?
(C)Is the change in the size of the restaurant a shift in the curve or a movement along the curve?
(A)Show the relationship between cooks and meals served by graphing two curves with cooks on the horizontal axis and the number of meals on the vertical axis.How do the slopes of the curves change as more cooks are employed?
(B)Is the change in the number of cooks a shift in the curve or a movement along the curve?
(C)Is the change in the size of the restaurant a shift in the curve or a movement along the curve?
(Essay)
4.7/5 (40)
A two-dimensional graph cannot be used to show what will happen to the relationship between X and Y if any of the ceteris paribus assumptions change.
(True/False)
4.9/5 (31)
Exhibit 2A-8  -There is a linear relationship between X and Y in Exhibit 2A-8.
(True/False)
4.8/5 (32)
Exhibit 2A-5 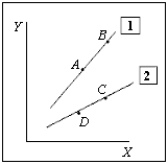 -Refer to Exhibit 2A-5.Which of the following would best explain the shift from line 1 to line 2?
(Multiple Choice)
4.8/5 (23)
The table below shows the inflation rate for the period 2005 through 2010.Suppose you wanted to show that there was not much variation in the inflation rate over this period.How would you represent this table in a graph? Suppose you wanted to show that there was a large amount of variation during this period.How would you represent this table in a graph? 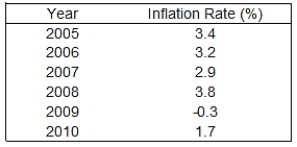
(Essay)
4.9/5 (40)
Filters
- Essay(0)
- Multiple Choice(0)
- Short Answer(0)
- True False(0)
- Matching(0)