Exam 3: Descriptive Statistics
Exam 1: Introduction to Statistics86 Questions
Exam 2: Charts and Graphs55 Questions
Exam 3: Descriptive Statistics59 Questions
Exam 4: Probability76 Questions
Exam 5: Discrete Distributions81 Questions
Exam 6: Continuous Distributions83 Questions
Exam 7: Sampling and Sampling Distributions87 Questions
Exam 8: Statistical Inference: Estimation for Single Populations82 Questions
Exam 9: Statistical Inference: Hypothesis Testing for Single Populations85 Questions
Exam 10: Statistical Inferences About Two Populations81 Questions
Exam 11: Analysis of Variance and Design of Experiments90 Questions
Exam 12: Simple Regression Analysis and Correlation98 Questions
Exam 13: Multiple Regression Analysis85 Questions
Exam 14: Building Multiple Regression Models78 Questions
Exam 15: Time-Series Forecasting and Index Numbers75 Questions
Exam 16: Analysis of Categorical Data77 Questions
Exam 17: Nonparametric Statistics76 Questions
Exam 18: Statistical Quality Control68 Questions
Exam 19: Decision Analysis79 Questions
Select questions type
A statistics student made the following grades on 7 tests: 76,82,92,95,79,86,and 92.What is the median grade?
Free
(Multiple Choice)
4.9/5  (39)
(39)
Correct Answer: Verified
A
The most frequently occurring value in a set of data is called the mode.
Free
(True/False)
4.8/5 (29)
Correct Answer:Verified
True
Jessica Salas,president of Salas Products,is reviewing the warranty policy for her company's new model of automobile batteries.Life tests performed on a sample of 100 batteries indicated: (1)an average life of 75 months,(2)a standard deviation of 5 months,and (3)a bell shaped battery life distribution.What percentage of the batteries will fail within the first 65 months of use?
Free
(Multiple Choice)
4.9/5 (31)
Correct Answer:Verified
C
It is inappropriate to use the mean to analyze data that are not at least interval level in measurement.
(True/False)
4.8/5 (43)
Computations of the variance and standard deviation using grouped data are potentially only
approximation of the actual variance and standard deviation.
(True/False)
4.9/5 (34)
According to Chebyshev's Theorem how many values in a data set will be within 3 standard deviations of the mean?
(Multiple Choice)
4.9/5 (31)
The empirical rule says that approximately what percentage of the values would be within 2 standard deviations of the mean in a bell shaped set of data?
(Multiple Choice)
4.8/5 (38)
The sample standard deviation is calculated by taking the square root of the population standard deviation.
(True/False)
4.8/5 (38)
The following box and whisker plot was constructed for the age of accounts receivable. 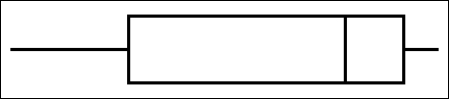 The box and whisker plot reveals that the accounts receivable ages are _______.
(Multiple Choice)
4.7/5 (32)
A sample of 117 records of the selling price in dollars of homes from Feb 15 to Apr 30,2013 was taken from the files maintained by the Albuquerque Board of Realtors.The following are
Summary statistics for the selling prices.
 From this we can conclude that,
(Multiple Choice)
4.8/5 (28)
A commuter travels many miles to work each morning.She has timed this trip 5 times during the last month.The time (in minutes)required to make this trip was 34,39,41,35,and 41.The mean time (in minutes)required for this trip was _______.
(Multiple Choice)
4.9/5 (34)
A commuter travels many miles to work each morning.She has timed this trip 5 times during the last month.The time (in minutes)required to make this trip was 38,33,36,47,and 41.What is the standard deviation for this sample data?
(Multiple Choice)
4.9/5 (45)
The sum of deviations about the arithmetic mean is always equal to zero.
(True/False)
4.8/5 (38)
Shaun Connor,Human Resources Manager forAmerican Oil Terminals (AOT),is reviewing the operator training hours at AOT nationally.His staff compiled the following table of national statistics on operators training hours.  What can Shaun conclude from these statistics?
(Multiple Choice)
5.0/5 (25)
An outlier of a data set is determined from the lower and upper quartile
(True/False)
4.8/5 (27)
The mean life of a particular brand of light bulb is 1200 hours and the standard deviation is 50 hours.We can conclude that at least 75% of this brand of bulbs will last between _______.
(Multiple Choice)
4.8/5 (27)
The following box and whisker plot was constructed for the age of accounts receivable. 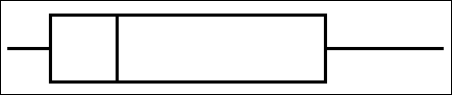 The box and whisker plot reveals that the accounts receivable ages are _______.
(Multiple Choice)
4.9/5 (31)
A nonzero value of the skewness indicates asymmetry of the distribution of the data.
(True/False)
4.8/5 (32)
In its Industry Norms and Key Business Ratios,Dun & Bradstreet reported that Q1,Q2,and Q3 for 2,037 gasoline service stations' sales to inventory ratios were 20.8,33.4,and 53.8,respectively.From this we can conclude that ____________.
(Multiple Choice)
4.9/5 (39)
The following frequency distribution was constructed for the wait times in the emergency room. 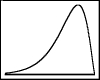 The frequency distribution reveals that the wait times in the emergency room are _______.
(Multiple Choice)
4.8/5 (32)
Filters
- Essay(0)
- Multiple Choice(0)
- Short Answer(0)
- True False(0)
- Matching(0)