Exam 13: Multiple Regression Analysis
Exam 1: Introduction to Statistics86 Questions
Exam 2: Charts and Graphs55 Questions
Exam 3: Descriptive Statistics59 Questions
Exam 4: Probability76 Questions
Exam 5: Discrete Distributions81 Questions
Exam 6: Continuous Distributions83 Questions
Exam 7: Sampling and Sampling Distributions87 Questions
Exam 8: Statistical Inference: Estimation for Single Populations82 Questions
Exam 9: Statistical Inference: Hypothesis Testing for Single Populations85 Questions
Exam 10: Statistical Inferences About Two Populations81 Questions
Exam 11: Analysis of Variance and Design of Experiments90 Questions
Exam 12: Simple Regression Analysis and Correlation98 Questions
Exam 13: Multiple Regression Analysis85 Questions
Exam 14: Building Multiple Regression Models78 Questions
Exam 15: Time-Series Forecasting and Index Numbers75 Questions
Exam 16: Analysis of Categorical Data77 Questions
Exam 17: Nonparametric Statistics76 Questions
Exam 18: Statistical Quality Control68 Questions
Exam 19: Decision Analysis79 Questions
Select questions type
The following ANOVA table is from a multiple regression analysis.  The adjusted R2 value is __________.
Free
(Multiple Choice)
4.8/5  (33)
(33)
Correct Answer: Verified
C
A multiple regression analysis produced the following tables. 
 Using = 0.05 to test the null hypothesis H0: 1 = 0,the critical t value is ____.
Free
(Multiple Choice)
4.7/5 (43)
Correct Answer:Verified
C
The following ANOVA table is from a multiple regression analysis with n = 35 and four independent variables.  The MSR value is __________.
Free
(Multiple Choice)
4.7/5 (32)
Correct Answer:Verified
D
A slope in a multiple regression model is known as a partial slope because it ignores the effects of other explanatory variables.
(True/False)
4.9/5 (25)
A cost accountant is developing a regression model to predict the total cost of producing a batch of printed circuit boards as a linear function of batch size (the number of boards produced in one lot or batch),production plant (Kingsland,and Yorktown),and production shift (day,and evening).The response variable in this model is ______.
(Multiple Choice)
4.9/5 (32)
A multiple regression analysis produced the following tables. 
 The adjusted R2 is ____________.
(Multiple Choice)
4.8/5 (39)
A multiple regression analysis produced the following tables. 
 These results indicate that ____________.
(Multiple Choice)
4.8/5 (34)
A market analyst is developing a regression model to predict monthly household expenditures on groceries as a function of family size,household income,and household neighborhood (urban,suburban,and rural).The "neighborhood" variable in this model is ______.
(Multiple Choice)
4.7/5 (38)
A multiple regression analysis produced the following tables. 
 For x1= 40 and x2 = 90,the predicted value of y is ____________.
(Multiple Choice)
4.7/5 (34)
In the multiple regression model y = 0 + 1x1 + 2x2 + 3x3 + ,the coefficients of the x variables are called partial regression coefficients.
(True/False)
4.8/5 (26)
The multiple regression formulas used to estimate the regression coefficients are designed to ________________.
(Multiple Choice)
4.9/5 (36)
A multiple regression analysis produced the following tables. 
 These results indicate that ____________.
(Multiple Choice)
4.9/5 (34)
A multiple regression analysis produced the following tables. 
 For x1= 30 and x2 = 100,the predicted value of y is ____________.
(Multiple Choice)
5.0/5 (36)
A cost accountant is developing a regression model to predict the total cost of producing a batch of printed circuit boards as a linear function of batch size (the number of boards produced in one lot or batch),production plant (Kingsland,and Yorktown),and production shift (day,and evening).In this model,"shift" is ______.
(Multiple Choice)
4.9/5 (36)
The following ANOVA table is from a multiple regression analysis with n = 35 and four independent variables.  The number of degrees of freedom for error is __________.
(Multiple Choice)
4.9/5 (42)
A multiple regression analysis produced the following tables. 
 The adjusted R2 is ____________.
(Multiple Choice)
4.8/5 (27)
Minitab and Excel output for a multiple regression model show the t tests for the regression coefficients but do not provide a t test for the regression constant.
(True/False)
4.9/5 (38)
The following ANOVA table is from a multiple regression analysis.  The value of the standard error of the estimate se is __________.
(Multiple Choice)
4.9/5 (39)
A multiple regression analysis produced the following tables. 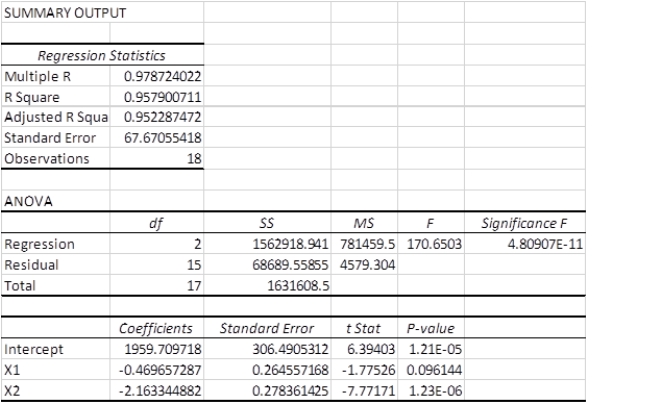 Using = 0.01 to test the model,these results indicate that ____________.
(Multiple Choice)
4.8/5 (44)
A human resources analyst is developing a regression model to predict electricity production plant manager compensation as a function of production capacity of the plant,number of employees at the plant,and plant technology (coal,oil,and nuclear).The "plant technology" variable in this model is ______.
(Multiple Choice)
4.8/5 (48)
Filters
- Essay(0)
- Multiple Choice(0)
- Short Answer(0)
- True False(0)
- Matching(0)