Exam 2: Charts and Graphs
Exam 1: Introduction to Statistics86 Questions
Exam 2: Charts and Graphs55 Questions
Exam 3: Descriptive Statistics59 Questions
Exam 4: Probability76 Questions
Exam 5: Discrete Distributions81 Questions
Exam 6: Continuous Distributions83 Questions
Exam 7: Sampling and Sampling Distributions87 Questions
Exam 8: Statistical Inference: Estimation for Single Populations82 Questions
Exam 9: Statistical Inference: Hypothesis Testing for Single Populations85 Questions
Exam 10: Statistical Inferences About Two Populations81 Questions
Exam 11: Analysis of Variance and Design of Experiments90 Questions
Exam 12: Simple Regression Analysis and Correlation98 Questions
Exam 13: Multiple Regression Analysis85 Questions
Exam 14: Building Multiple Regression Models78 Questions
Exam 15: Time-Series Forecasting and Index Numbers75 Questions
Exam 16: Analysis of Categorical Data77 Questions
Exam 17: Nonparametric Statistics76 Questions
Exam 18: Statistical Quality Control68 Questions
Exam 19: Decision Analysis79 Questions
Select questions type
The staff of Mr.Wayne Wertz,VP of Operations at Portland Peoples Bank,prepared a frequency histogram of waiting time for drive up ATM customers. 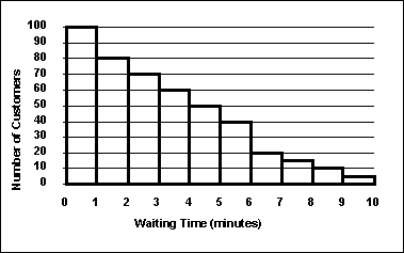 Approximately ____ drive up ATM customers waited at least 7 minutes.
Free
(Multiple Choice)
4.8/5  (46)
(46)
Correct Answer: Verified
B
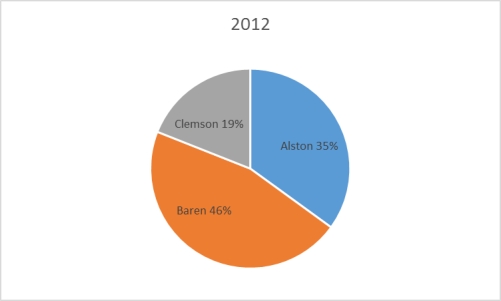
The 2010 and 2012 market share data of the three competitors (Alston,Baren,and Clemson)in an oligopolistic industry are presented in the following pie charts.Total sales for this industry were $1.5 billion in 2010 and $1.8 billion in 2012. Baren's sales in 2010 were ___________. 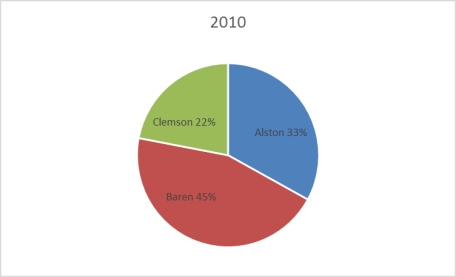
Free
(Multiple Choice)
4.7/5 (36)
Correct Answer:Verified
C
The staff of Ms.Tamara Hill,VP of Technical Analysis at Blue Sky Brokerage,prepared a frequency histogram of market capitalization of the 937 corporations listed on the American Stock Exchange in January 2013. 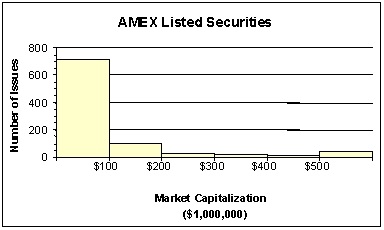 Approximately ________ corporations had capitalizations of $200,000,000 or less.
Free
(Multiple Choice)
5.0/5 (20)
Correct Answer:Verified
D
The staff of Mr.Wayne Wertz,VP of Operations at Portland Peoples Bank,prepared a cumulative frequency ogive of waiting time for walk-in customers. 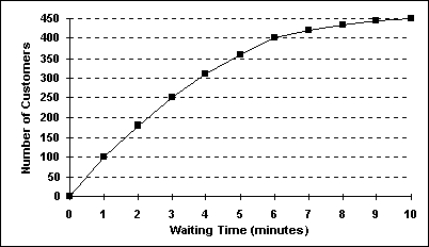 The percentage of walk-in customers waiting more than 6 minutes was ______.
(Multiple Choice)
4.8/5 (31)
Each day,the office staff at Oasis Quick Shop prepares a frequency distribution and an ogive of sales transactions by dollar value of the transactions.Saturday's cumulative frequency ogive follows.  The percentage of sales transactions on Saturday that were under $100 each was _____________.
(Multiple Choice)
4.9/5 (40)
According to the following graphic,"Bent Pins" account for ____% of PCB Failures. 
(Multiple Choice)
4.8/5 (30)
A Pareto chart and a pie chart are both types of qualitative graphs.
(True/False)
5.0/5 (28)
Suppose a market survey of 200 consumers was conducted to determine the likelihood of each consumer purchasing a new computer next year.The data were collected based on the age of the
Consumer and are shown below:
 Using the table above,which of the following statements is true?
(Multiple Choice)
4.9/5 (39)
The United Nations Development Programme website provides comparative data by country on key metrics.Two such metrics are life expectancy and expenditures on health as a percent of
GDP.The table below show data on life expectancy and health expenditures in the United States.
 Which of the following scatterplots best depicts the relationship between life expectancy and
Expenditures on health as a percent of GDP?
Which of the following scatterplots best depicts the relationship between life expectancy and
Expenditures on health as a percent of GDP?
(Multiple Choice)
4.9/5 (36)
An instructor has decided to graphically represent the grades on a test.The instructor uses a plus/minus grading system (i.e.she gives grades of A-,B+,etc.).Which of the following would provide the most information for the students?
(Multiple Choice)
4.9/5 (30)
If the individual class frequency is divided by the total frequency,the result is the median frequency.
(True/False)
4.8/5 (36)
Each day,the office staff at Oasis Quick Shop prepares a frequency distribution and an ogive of sales transactions by dollar value of the transactions.Saturday's cumulative frequency ogive follows. 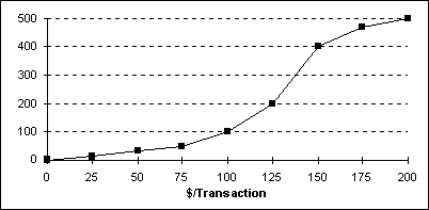 The percentage of sales transactions on Saturday that were at least $100 each was _____________.
(Multiple Choice)
4.9/5 (37)
According to the following graphic,the most common cause of PCB Failures is a _____________. 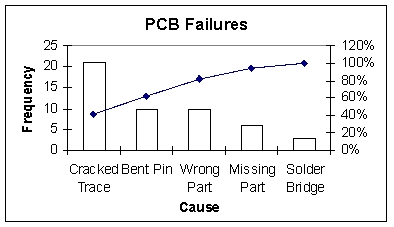
(Multiple Choice)
4.9/5 (44)
For a company in gardening supplies business,the best graphical way to show the percentage of a total budget that is spent on each of a number of different expense categories is the stem and leaf plot.
(True/False)
4.9/5 (38)
One advantage of a stem and leaf plot over a frequency distribution is that the values of the original data are retained.
(True/False)
4.8/5 (37)
One rule that must always be followed in constructing frequency distributions is that the adjacent classes must overlap.
(True/False)
4.8/5 (34)
A scatter plot is a two-dimensional graph plot of data containing pairs of observations on two numerical variables.
(True/False)
4.8/5 (39)
A scatter plot shows how the numbers in a data set are scattered around their average.
(True/False)
4.8/5 (33)
The staff of Mr.Wayne Wertz,VP of Operations at Portland Peoples Bank,prepared a cumulative frequency ogive of waiting time for walk-in customers.  The percentage of walk-in customers waiting between 1 and 6 minutes was ___.
(Multiple Choice)
4.9/5 (37)
Filters
- Essay(0)
- Multiple Choice(0)
- Short Answer(0)
- True False(0)
- Matching(0)