Exam 18: Statistical Quality Control
Exam 1: Introduction to Statistics86 Questions
Exam 2: Charts and Graphs55 Questions
Exam 3: Descriptive Statistics59 Questions
Exam 4: Probability76 Questions
Exam 5: Discrete Distributions81 Questions
Exam 6: Continuous Distributions83 Questions
Exam 7: Sampling and Sampling Distributions87 Questions
Exam 8: Statistical Inference: Estimation for Single Populations82 Questions
Exam 9: Statistical Inference: Hypothesis Testing for Single Populations85 Questions
Exam 10: Statistical Inferences About Two Populations81 Questions
Exam 11: Analysis of Variance and Design of Experiments90 Questions
Exam 12: Simple Regression Analysis and Correlation98 Questions
Exam 13: Multiple Regression Analysis85 Questions
Exam 14: Building Multiple Regression Models78 Questions
Exam 15: Time-Series Forecasting and Index Numbers75 Questions
Exam 16: Analysis of Categorical Data77 Questions
Exam 17: Nonparametric Statistics76 Questions
Exam 18: Statistical Quality Control68 Questions
Exam 19: Decision Analysis79 Questions
Select questions type
A quality circle studying the problem of incorrect prices on purchase orders identified several potential causes: incorrect information from requesting department,out-of-date catalogs from suppliers,defective computer software,and worker practices in the purchasing department.These potential cause-and-effect relationships are best illustrated by a _______________.
Free
(Multiple Choice)
4.8/5  (31)
(31)
Correct Answer: Verified
E
Nels Neugent,Purchasing Manager at Mid-West Medical Center,is designing a p chart to monitor the proportion of defective purchase orders issued at Mid-West.He has the proportions defective for 22 samples of purchase orders.Each sample contains 150 purchase orders,and the average proportion defective is 0.08.The lower control limit for Nels's p chart is ___________.
Free
(Multiple Choice)
4.8/5 (35)
Correct Answer:Verified
C
An R Chart is to be developed for use in quality control.The average of the ranges is calculated to be 0.60.This was based on several samples of size 7 each.What would the upper control limit be?
Free
(Multiple Choice)
4.8/5 (35)
Correct Answer:Verified
E
A p Chart is to be developed for use in quality control.The value of p is calculated to be 0.05.The sample size is 50.What would the upper control limit be?
(Multiple Choice)
4.9/5 (38)
If no variation occurred between manufactured items,the resulting points on a control chart would form a horizontal line.
(True/False)
4.9/5 (41)
A graph that plots the proportions of items in noncompliance for multiple samples is called a(n)_______.
(Multiple Choice)
4.9/5 (31)
Ophelia O'Brien,VP of Consumer Credit of American First Banks (AFB),is designing a p chart to monitor the default rate on personal loans at the AFB member banks.Her data includes the proportion in default for 30 samples of personal loans.Each sample contains 50 loans,and the average of the 30 proportions is 0.05.The upper control limit for Ophelia's p chart is _____________.
(Multiple Choice)
4.8/5 (32)
Jack Joyner,Director of Quality Control at Covington Castings (CC),is designing a c chart to monitor the number of nonconformances per aluminum casting produced at CC.The total number of nonconformances for 26 castings is 91.The lower control limit for Jack's c chart is ___________.
(Multiple Choice)
4.8/5 (31)
Failure Mode Effect Analysis is best described as _________.
(Multiple Choice)
4.8/5 (27)
According to the following Pareto chart,the Pareto principle would suggest a quality improvement team focus their efforts on which of the following complaints?
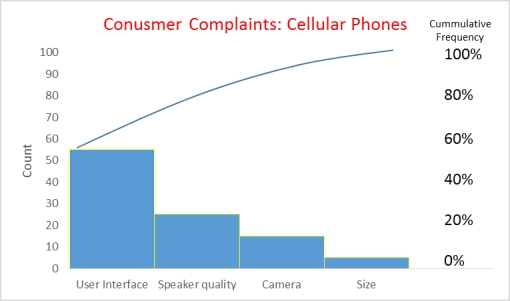
(Multiple Choice)
4.9/5 (39)
Quality control can be undertaken in two distinct ways: after-process control and before-process control.
(True/False)
4.8/5 (31)
A p Chart is to be developed for use in quality control.The value of p is calculated to be 0.54.The sample size is 249.What would the upper control limit be?
(Multiple Choice)
4.9/5 (33)
A company that uses benchmarking as a quality improvement practice will ________.
(Multiple Choice)
4.8/5 (30)
Upper and lower control limits are usually based upon _______.
(Multiple Choice)
4.9/5 (36)
An R Chart is to be developed for use in quality control.The average of the ranges is calculated to be 0.45.The sample sizes were 9 each.What would the lower control limit be?
(Multiple Choice)
4.7/5 (35)
A Pareto chart is a diagnostic tool that displays possible causes of a quality problem and the interrelationships among the causes.
(True/False)
4.8/5 (40)
Edward Deming is a quality guru whose principles of quality management can be summarized through four basic tenets,or "Absolutes".
(True/False)
4.8/5 (36)
Sarah Soliz,Director of Quality Programs,is designing  and R charts for the rod shearing process at Stockton Steel.She has 26 samples of rod length,and each sample included measurements of 5 rods.The mean of the 26 sample means is 112 inches,and mean of the 26 ranges is 0.15 inch.The lower control limit for her
  chart is ____.
(Multiple Choice)
5.0/5 (42)
Ophelia O'Brien,VP of Consumer Credit of American First Banks (AFB),is designing a p chart to monitor the default rate on personal loans at the AFB member banks.Her data includes the proportion in default for 30 samples of personal loans.Each sample contains 50 loans,and the average of the 30 proportions is 0.05.The lower control limit for Ophelia's p chart is _____________.
(Multiple Choice)
4.8/5 (33)
Higher output wattage means higher quality to some consumers of audio amplifiers.Among Garvin's five quality types,this is an example of ______________.
(Multiple Choice)
4.9/5 (35)
Filters
- Essay(0)
- Multiple Choice(0)
- Short Answer(0)
- True False(0)
- Matching(0)