Exam 5: Data Organization and Descriptive Statistics
Exam 1: Thinking Like a Scientist54 Questions
Exam 2: Getting Started: Ideas, resources, and Ethics34 Questions
Exam 3: Defining, measuring, and Manipulating Variables62 Questions
Exam 4: Descriptive Methods55 Questions
Exam 5: Data Organization and Descriptive Statistics46 Questions
Exam 6: Correlational Methods and Statistics37 Questions
Exam 7: Probability and Hypothesis Testing61 Questions
Exam 8: Introduction to Inferential Statistics63 Questions
Exam 9: The Logic of Experimental Design43 Questions
Exam 10: Inferential Statistics: Two-Group Designs39 Questions
Exam 11: Experimental Designs With More Than Two Levels of an Independent Variable34 Questions
Exam 12: Complex Experimental Design46 Questions
Exam 13: Quasi-Experimental and Single-Case Designs43 Questions
Exam 14: Apa Communication Guidelines14 Questions
Select questions type
Faculty in the psychology department at State University consume an average of 5 cups of coffee per day with a standard deviation of 1.5.The distribution is normal.What is the percentile rank for an individual who consumed 8 cups of coffee per day?
Free
(Multiple Choice)
4.8/5  (35)
(35)
Correct Answer: Verified
A
If Joe scored 25 on a test with a mean of 20 and a standard deviation of 5 what is his z-score?
Free
(Multiple Choice)
4.9/5 (43)
Correct Answer:Verified
B
A z-score is most affected by the
Free
(Multiple Choice)
4.9/5 (38)
Correct Answer:Verified
C
Imagine that 86,999 people who are penniless live in Centerville.Bill Gates,whose net worth is $87,000,000,000 moves to Centerville.Now the mean net worth in this town is _____ and the median net worth is _____.
(Multiple Choice)
4.8/5 (24)
A variable for which the scores represent a change in quantity is a _____ variable.
(Multiple Choice)
4.9/5 (37)
Draw the frequency polygon for the following distribution (there are 30 scores in the distribution).In addition,calculate the mean,median,and mode for the distribution.
48,50,53,59,59,63,63,67,67,67,72,72,72,78,78,78,78,85,85,85,85,85,90,90,90,90,95,95,98,100 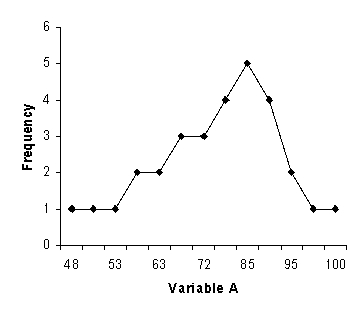
(Short Answer)
4.9/5 (33)
A graphical representation of a frequency distribution in which vertical bars are centered above each category along the x-axis and are separated from each other by a space,is a _____.
(Multiple Choice)
4.8/5 (28)
A categorical variable for which each value represents a discrete category is a _____ variable.
(Multiple Choice)
4.9/5 (38)
The calculation of the average deviation differs from the calculation of the standard deviation in that when calculating the average deviation the difference scores are
(Multiple Choice)
4.7/5 (35)
A number that characterizes the "middleness" of an entire distribution is _____.
(Multiple Choice)
4.9/5 (30)
Faculty in the psychology department at State University consume an average of 5 cups of coffee per day with a standard deviation of 1.5.The distribution is normal.What proportion of faculty consumes an amount between 4 and 6 cups?
(Multiple Choice)
4.7/5 (27)
During the past year,Cindy and Bobby each read 2 books,but Greg read 25,Jan read 12,and Marcia read 9.The median number of books read by these individuals was
(Multiple Choice)
4.8/5 (37)
A graphical representation of a frequency distribution in which vertical bars centered above scores on the x-axis touch each other is a _____.
(Multiple Choice)
4.7/5 (37)
A distribution can have more than one ____ but can have only one _____.
(Multiple Choice)
4.8/5 (31)
_____ is to organizing data using a table as _____ is to organizing data using a figure.
(Multiple Choice)
4.9/5 (45)
Sue took a test in both biology and math last week.The biology test had a mean of 70 and a standard deviation of 7 whereas the math test had a mean of 75 and a standard deviation of 10.Sue scored a 76 on the biology test and a 76 on the math test.On which test did she do better in comparison to the rest of the class?
(Multiple Choice)
4.8/5 (31)
Explain the difference between qualitative and quantitative variables noting the relationship of nominal,ordinal,interval,and ratio data to these terms.
(Essay)
4.9/5 (32)
Karen's first psychology exam score is ?1 standard deviation from the mean in a normal distribution.The test has a mean of 75 and a standard deviation of 5.Karen's percentile rank would be
(Multiple Choice)
4.8/5 (31)
Filters
- Essay(0)
- Multiple Choice(0)
- Short Answer(0)
- True False(0)
- Matching(0)