Exam 2: Frequency Distributions and Graphs
Exam 1: The Nature of Probability and Statistics47 Questions
Exam 2: Frequency Distributions and Graphs73 Questions
Exam 3: Data Description73 Questions
Exam 4: Probability and Counting Rules85 Questions
Exam 5: Discrete Probability Distributions69 Questions
Exam 6: The Normal Distribution81 Questions
Exam 7: Confidence Intervals and Sample Size75 Questions
Exam 8: Hypothesis Testing83 Questions
Exam 9: Testing the Difference Between Two Means, Two Variances, and Two Proportions70 Questions
Exam 10: Correlation and Regression63 Questions
Exam 11: Other Chi-Square Tests47 Questions
Exam 12: Analysis of Variance54 Questions
Exam 13: Nonparametric Statistics63 Questions
Exam 14: Sampling and Simulation58 Questions
Select questions type
Which graph should be used to represent the frequencies with which certain courses are taken at Highlands Middle School?
(Multiple Choice)
4.8/5  (40)
(40)
When data are collected in original form, they are called __________.
(Short Answer)
4.8/5 (45)
The scores on a recent statistics exam are shown below. Construct a stem and leaf plot for the data.
98, 73, 64, 69, 86, 89, 77, 86, 91, 73
(Short Answer)
4.8/5 (43)
A pie graph is not useful in showing which of the following characteristics of a data set?
(Multiple Choice)
4.9/5 (37)
Which of the following could be a cumulative frequency graph?
(Multiple Choice)
4.9/5 (33)
The following information shows the colors of cars preferred by customers. Draw a pie graph and indicate how many degrees that black represents in a pie graph? 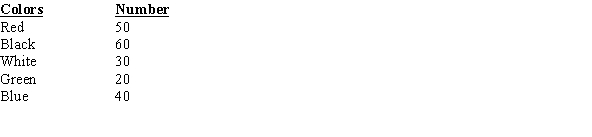
(Essay)
4.8/5 (32)
When the range is large, and classes that are several units in width are needed, a __________ frequency distribution is used.
(Short Answer)
4.9/5 (51)
When two sets of data collected over specific periods of time are compared on the same graph using two lines, it is called a compound time series graph.
(True/False)
4.7/5 (32)
A Pareto chart does not have which of the following properties?
(Multiple Choice)
4.9/5 (41)
A Pareto chart is useful for showing percentages of the total at different times.
(True/False)
4.9/5 (42)
Which of the following does not need to be done when constructing a frequency distribution?
(Multiple Choice)
4.7/5 (38)
Graphs give a visual representation that may enable readers to analyze and interpret data more easily than simply looking at tables of numbers.
(True/False)
4.8/5 (42)
If a data set showing types of pizza ordered at a particular restaurant indicates 24 out of 72 orders were for pepperoni pizza, how many degrees would be needed to represent pepperoni pizza in a pie chart?
(Multiple Choice)
4.7/5 (37)
Filters
- Essay(0)
- Multiple Choice(0)
- Short Answer(0)
- True False(0)
- Matching(0)