Exam 2: Frequency Distributions and Graphs
Exam 1: The Nature of Probability and Statistics47 Questions
Exam 2: Frequency Distributions and Graphs73 Questions
Exam 3: Data Description73 Questions
Exam 4: Probability and Counting Rules85 Questions
Exam 5: Discrete Probability Distributions69 Questions
Exam 6: The Normal Distribution81 Questions
Exam 7: Confidence Intervals and Sample Size75 Questions
Exam 8: Hypothesis Testing83 Questions
Exam 9: Testing the Difference Between Two Means, Two Variances, and Two Proportions70 Questions
Exam 10: Correlation and Regression63 Questions
Exam 11: Other Chi-Square Tests47 Questions
Exam 12: Analysis of Variance54 Questions
Exam 13: Nonparametric Statistics63 Questions
Exam 14: Sampling and Simulation58 Questions
Select questions type
For a given data set, the ogive and the frequency polygon will have the same overall shape.
(True/False)
4.9/5  (29)
(29)
A time series graph is useful for detecting trends that occur over the period of time.
(True/False)
4.9/5 (32)
A time series graph represents data that occur over a specific time period.
(True/False)
4.8/5 (35)
If a frequency distribution had class boundaries of 132.5-147.5, what would be the class width?
(Short Answer)
4.8/5 (34)
Which type of graph represents the data by using vertical bars of various heights to indicate frequencies?
(Multiple Choice)
4.8/5 (33)
Given the following frequency distribution, how many pieces of data were less than 28.5? 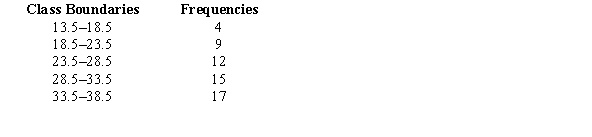
(Multiple Choice)
4.9/5 (41)
Greg wants to construct a frequency distribution for the political affiliation of the employees at Owen's Hardware Store. What type of distribution would be best?
(Multiple Choice)
4.9/5 (36)
If the graph of a frequency distribution has a peak and the data tapers off more slowly to the right and more quickly to the left, the distribution is said to be ____________.
(Short Answer)
4.9/5 (31)
How many values are in the data set whose histogram is shown below ? 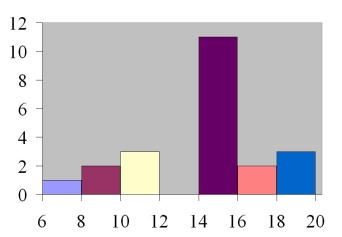
(Multiple Choice)
4.9/5 (38)
The cumulative frequency for a class is the sum of the frequencies of the classes less than and equal to the upper boundary of the specific class.
(True/False)
4.8/5 (37)
A pie graph would best represent the number of inches of rain that has fallen in Ohio each day for the past 2 months.
(True/False)
4.9/5 (35)
Given the following two sets of data, draw a back-to-back stem and leaf plot.
A - 12, 22, 22, 24, 34, 31, 26, 35, 27, 39, 49, 10
B - 45, 36, 23, 16, 37, 28, 18, 13, 10, 23, 30, 31
(Essay)
4.9/5 (45)
The percentages of white, wheat, and rye bread sold at a supermarket each week is best shown using a __________ graph.
(Short Answer)
4.8/5 (40)
Filters
- Essay(0)
- Multiple Choice(0)
- Short Answer(0)
- True False(0)
- Matching(0)