Exam 13: Nonparametric Statistics
Exam 1: The Nature of Probability and Statistics47 Questions
Exam 2: Frequency Distributions and Graphs73 Questions
Exam 3: Data Description73 Questions
Exam 4: Probability and Counting Rules85 Questions
Exam 5: Discrete Probability Distributions69 Questions
Exam 6: The Normal Distribution81 Questions
Exam 7: Confidence Intervals and Sample Size75 Questions
Exam 8: Hypothesis Testing83 Questions
Exam 9: Testing the Difference Between Two Means, Two Variances, and Two Proportions70 Questions
Exam 10: Correlation and Regression63 Questions
Exam 11: Other Chi-Square Tests47 Questions
Exam 12: Analysis of Variance54 Questions
Exam 13: Nonparametric Statistics63 Questions
Exam 14: Sampling and Simulation58 Questions
Select questions type
If a researcher using the sign test has 15 positive signs and 19 negative signs in a test involving 34 samples, the z test value is ________.
(Multiple Choice)
4.9/5  (35)
(35)
Six second grade students tried tossing a ball into a basket ten times each. Their teacher then suggested a different way of tossing the ball, and the six students tried again. The number of successful tosses, before and after the teacher's added instruction, are shown below. ![Six second grade students tried tossing a ball into a basket ten times each. Their teacher then suggested a different way of tossing the ball, and the six students tried again. The number of successful tosses, before and after the teacher's added instruction, are shown below. Find the signed rank of child A's difference. [Recall, differences of zero are not ranked.]](https://storage.examlex.com/TB1705/11eaa984_72d2_b4b5_97c0_af30ea799ce5_TB1705_00.jpg) Find the signed rank of child A's difference. [Recall, differences of zero are not ranked.]
Find the signed rank of child A's difference. [Recall, differences of zero are not ranked.]
(Multiple Choice)
5.0/5 (39)
Six second grade students tried tossing a ball into a basket ten times each. Their teacher then suggested a different way of tossing the ball, and the six students tried again. The number of successful tosses, before and after the teacher's suggestion, are shown below.
Find the negative rank sum. [Recall, differences of zero are not ranked.]
(Multiple Choice)
4.8/5 (33)
A random sample of 12 men and 12 women were asked to report the number of hours they watched television on a Wednesday evening. If a researcher wants to test the hypothesis that there is no difference in the amount of time spent watching television based on gender, what z-values should be used for a two-tailed Wilcoxon rank sum test, at α = 0.05?
(Multiple Choice)
4.8/5 (37)
For a specific year, the median price of natural gas was $10.65 per 1000 cubic feet. A researcher wishes to see if there is enough evidence to reject the claim. Out of 36 households, 26 paid less than $10.65 per 1000 cubic feet for natural gas. Test the claim at  .
.
(Essay)
4.7/5 (35)
Two students were asked to rate six different television shows on a scale from 1 to 10 points, with higher values ranking ahead of lower values. The data are shown in the following table: 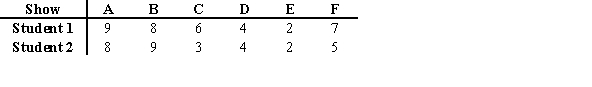 Which table shows the appropriate differences in the rankings needed in the computation of the Spearman rank correlation coefficient?
(Multiple Choice)
4.9/5 (35)
Test the following sequence for randomness at α = 0.05.
A A A A B B B A A A B B
Table of Critical Values for the Number of Runs, α = 0.05
Value of
N1
Value of n2
4
5
6
7
6
2
9
3
10
3
11
3
12
7
2
10
3
11
3
12
3
13
8
3
10
3
11
3
12
4
13
(Multiple Choice)
4.9/5 (28)
If a researcher using the sign test counts 16 positive signs and 9 negative signs, the test value is ______.
(Multiple Choice)
4.7/5 (38)
A researcher needs to conduct a suitable nonparametric test to compare two dependent variables. Which of the following should he use?
(Multiple Choice)
4.8/5 (39)
Which of the following is not an advantage of nonparametric methods over parametric methods?
(Multiple Choice)
4.9/5 (34)
Men and women were randomly selected to rate eight television programs on a scale of 1 to 50 with 50 being the best score. The average ratings are shown in the table below. Use the Spearman rank correlation coefficient at α = 0.05 to determine if there is a correlation between the rankings of men and women. 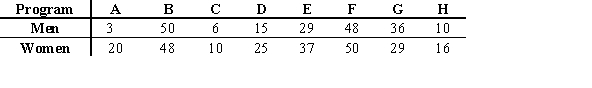
(Essay)
4.7/5 (40)
When performing a sign test, one needs to consider whether or not data values are greater or less than a hypothesized median, as well as the magnitude of the differences between the values and the hypothesized median..
(True/False)
4.7/5 (37)
If a panel of two judges were asked to rank 10 science fair projects, and the sum of the squares of the differences in the ranks was 49.5, then the Spearman rank correlation coefficient would be 0.70.
(True/False)
4.8/5 (32)
A social studies teacher wanted to see whether the students exit the classroom randomly by gender. He observed the gender of students leaving the classroom in the order given below. Test for randomness at α = 0.05.
M M M M M M F F F F F F F F F M M F F F
(Essay)
4.9/5 (39)
The _______________ is used to test a hypothesis about a median value for a sample. It includes counting the number of values greater or less than the hypothesized median value.
(Short Answer)
4.8/5 (37)
If the test value for a Wilcoxon signed-rank test ws is 15, the sample size is 12, and the one-tailed test is to be carried out at the α = 0.05 level of significance, should the null hypothesis be rejected? Use the table of critical values for the signed-rank test below.
N
One-tailed,
Α = 0.05
Α = 0.025
Α = 0.01
Two-tailed,
Α = 0.10
Α = 0.050
Α = 0
02
10
11
8
5
11
14
11
7
12
17
14
10
13
21
17
13
14
26
21
16
15
30
25
20
(Multiple Choice)
4.7/5 (31)
Use the following to answer questions 21-24:
A landscaping company hypothesizes that the median number of lawns they mow in a weekend is 20. They tabulated the number of lawns mowed in a random sample of 14 weekends.  = .05), taken from Table J in the text:
 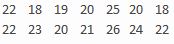 -What critical value should be used for this two-tailed test at α = 0.10?
(Multiple Choice)
4.7/5 (31)
Nonparametric methods are more sensitive than their parametric counterparts even when the assumptions of the parametric methods are met.
(True/False)
4.8/5 (40)
An instructor divided her class into four groups and asked them to keep track of the number of soft drinks that they consume per week. The data has been ranked and the sums determined for each group.
The sums of the ranks for the four groups is as follows: 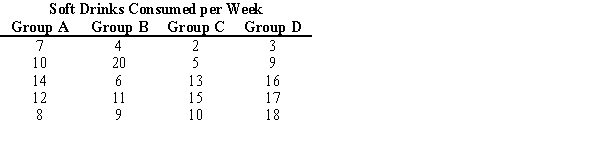 RA = 51.5 ;RB = 48.5 ;RC = 45.5 ;RD = 64.5
Complete the Kruskal-Wallis test to determine if the hypothesis that the different groups consume the same amount of soft drinks per week is valid at α = 0.05.
RA = 51.5 ;RB = 48.5 ;RC = 45.5 ;RD = 64.5
Complete the Kruskal-Wallis test to determine if the hypothesis that the different groups consume the same amount of soft drinks per week is valid at α = 0.05.
(Essay)
4.8/5 (35)
The following data was collected as part of a study examining whether there is a difference between the number of hours men and women watch television. The values represent the number of hours a subject watched television on a designated Monday night. Lower values rank ahead of higher ones. 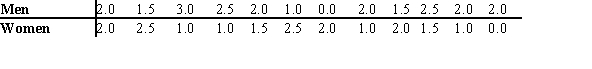 Calculate
  ,
,  , and the z test value for the Wilcoxon rank sum test.
(Multiple Choice)
4.8/5 (32)
Filters
- Essay(0)
- Multiple Choice(0)
- Short Answer(0)
- True False(0)
- Matching(0)