Exam 10: Correlation and Regression
Exam 1: The Nature of Probability and Statistics47 Questions
Exam 2: Frequency Distributions and Graphs73 Questions
Exam 3: Data Description73 Questions
Exam 4: Probability and Counting Rules85 Questions
Exam 5: Discrete Probability Distributions69 Questions
Exam 6: The Normal Distribution81 Questions
Exam 7: Confidence Intervals and Sample Size75 Questions
Exam 8: Hypothesis Testing83 Questions
Exam 9: Testing the Difference Between Two Means, Two Variances, and Two Proportions70 Questions
Exam 10: Correlation and Regression63 Questions
Exam 11: Other Chi-Square Tests47 Questions
Exam 12: Analysis of Variance54 Questions
Exam 13: Nonparametric Statistics63 Questions
Exam 14: Sampling and Simulation58 Questions
Select questions type
A regression line was calculated as 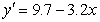 . The slope of this line is -3.2.
(True/False)
4.8/5  (33)
(33)
In a multiple regression model y' = -11 + 4x1 + 11x2 + 7x3 + 3x4, if the value of x2 increases by 2 and the value of x3 decreases by 5, then the predicted value for y will
(Multiple Choice)
4.8/5 (34)
If the correlation coefficient is 0.790, what is the explained variation?
(Multiple Choice)
4.7/5 (28)
The standard error of the estimate is the standard deviation of the observed x-values about the predicted  values.
(True/False)
4.8/5 (30)
A psychologist wants to determine if there is a linear relationship between the number of hours a person goes without sleep and the number of mistakes he/she makes on a simple test. The following data is recorded.
a. Draw a scatter plot.
b. Determine the regression line equation and plot the regression line
on the scatter plot. 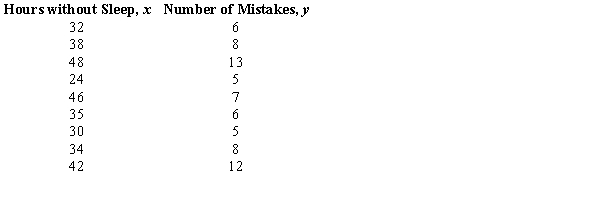
(Essay)
4.8/5 (35)
A positive relationship exists when both variables increase or decrease at the same time.
(True/False)
4.8/5 (40)
A multiple regression line was calculated in which x1 was a student's grade point average and x2 was a student's age. The multiple regression line was calculated as 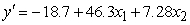 . If a student has a grade point average of 5.9 and is 20 years old, what is the predicted value of
  ?
?
(Multiple Choice)
4.8/5 (33)
Test the significance of the correlation coefficient r at  = 0.05 for the data below.
(Multiple Choice)
4.8/5 (43)
An experiment is carried out to determine the relationship between the average speed (rpm) and power (hp) of a mixer. Draw the scatter plot for the variables. 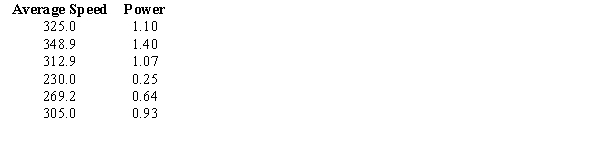
(Essay)
4.8/5 (41)
If the correlation coefficient r is equal to 0.755, find the coefficient of determination and the coefficient of nondetermination.
(Multiple Choice)
4.8/5 (31)
Compute the standard error of the estimate for the data below. 
(Multiple Choice)
4.8/5 (33)
A correlation coefficient r was calculated to be 0.830. The coefficient of nondetermination would be 0.170.
(True/False)
4.7/5 (41)
If the equation for the regression line is y' = 7x - 9, then a value of x = 2 will result in a predicted value for y of
(Multiple Choice)
4.7/5 (33)
An analysis results in a multiple regression equation of y' = 73 + 24x1+ 7x2. We can conclude that
(Multiple Choice)
5.0/5 (20)
If the correlation coefficient r is equal to 0.552, find the coefficient of nondetermination.
(Multiple Choice)
4.8/5 (42)
Filters
- Essay(0)
- Multiple Choice(0)
- Short Answer(0)
- True False(0)
- Matching(0)