Exam 10: Correlation and Regression
Exam 1: The Nature of Probability and Statistics47 Questions
Exam 2: Frequency Distributions and Graphs73 Questions
Exam 3: Data Description73 Questions
Exam 4: Probability and Counting Rules85 Questions
Exam 5: Discrete Probability Distributions69 Questions
Exam 6: The Normal Distribution81 Questions
Exam 7: Confidence Intervals and Sample Size75 Questions
Exam 8: Hypothesis Testing83 Questions
Exam 9: Testing the Difference Between Two Means, Two Variances, and Two Proportions70 Questions
Exam 10: Correlation and Regression63 Questions
Exam 11: Other Chi-Square Tests47 Questions
Exam 12: Analysis of Variance54 Questions
Exam 13: Nonparametric Statistics63 Questions
Exam 14: Sampling and Simulation58 Questions
Select questions type
If there is a strong negative linear relationship between the variables, the value of __________ will be close to -1.
(Short Answer)
4.7/5  (43)
(43)
A correlation coefficient r was calculated to be 0.610. The coefficient of determination would be approximately __________.
(Short Answer)
4.8/5 (36)
In a __________ relationship, as one variable increases, the other variable decreases, and vice versa.
(Short Answer)
4.8/5 (37)
If the correlation coefficient r is equal to 0.394, find the coefficient of nondetermination.
(Multiple Choice)
4.8/5 (33)
Regression is a statistical method used to describe the nature of the relationship between variables.
(True/False)
4.8/5 (37)
For a prediction value of y' from a specific value x, which of the following contribute to the prediction error?
(Multiple Choice)
4.9/5 (42)
The rounding rule for the correlation coefficient requires two decimal places.
(True/False)
4.9/5 (35)
The equation of a regression line is 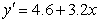 . What is the intercept of this line?
(Multiple Choice)
4.9/5 (26)
Compute the standard error of the estimate for the data below. Round to the thousandths place. 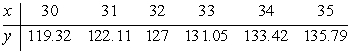
(Multiple Choice)
4.9/5 (30)
A realtor wanted to determine if there was a relationship between the size (in 100 square feet) of a new custom-built home and the price (in thousands of dollars) of the home.
a. Draw a scatter plot.
b. Determine the regression line equation and plot the regression line
on the scatter plot. 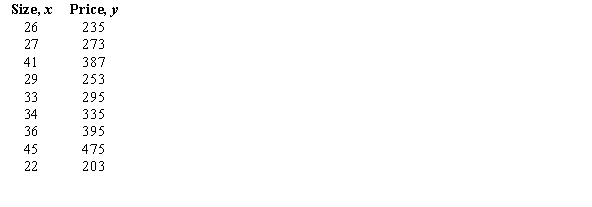
(Essay)
4.9/5 (37)
Daniel Wiseman, a scientist for Gres-Trans Corp., wants to determine if the flow rate of a particular material changes with different changes in temperature. The data is plotted in the figure below. What type of relationship exists between the flow rate and the change in temperature? 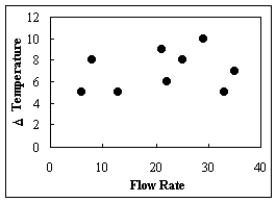
(Multiple Choice)
4.9/5 (30)
Using a regression line of 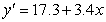 , a value of x = 3.6 would result in a predicted value of
  .
.
(True/False)
5.0/5 (37)
Determine the type of relationship shown in the figure below. 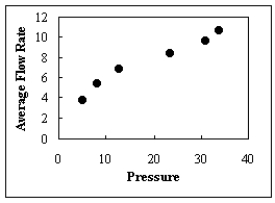
(Multiple Choice)
4.9/5 (30)
A correlation coefficient of 0.961 would mean that the values of x increase as the values of y decrease.
(True/False)
4.8/5 (35)
As a researcher collects more and more data, the 95% prediction intervals in general
(Multiple Choice)
4.9/5 (37)
The population correlation coefficient is computed by using all possible pairs of data values  taken from a population.
(True/False)
4.8/5 (32)
The standard error of estimate is the square root of the unexplained variation.
(True/False)
4.7/5 (41)
A study was conducted to determine if there was a linear relationship between a person's age and his/her peak heart rate.
a. Draw the scatter plot for the variables.
b. Give a brief explanation of the type of relationship. 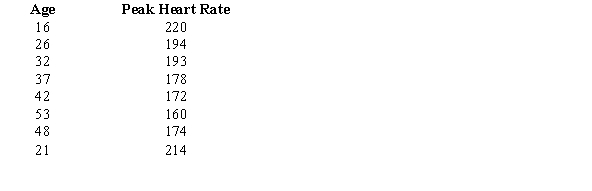
(Essay)
4.9/5 (41)
A study was conducted to determine if there was a relationship between the prices a non-member of a book club paid for various publications and the prices that a member paid for the same publications. The data gathered is shown below. Compute the value of the correlation coefficient. 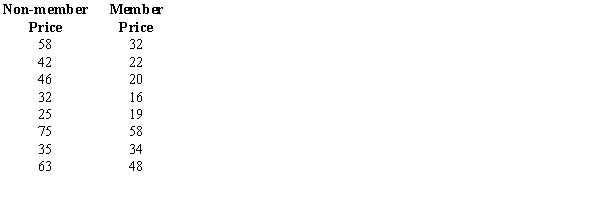
(Multiple Choice)
4.7/5 (26)
Filters
- Essay(0)
- Multiple Choice(0)
- Short Answer(0)
- True False(0)
- Matching(0)