Exam 12: Introduction to Simulation Using Analytic Solver Platform
Exam 1: Introduction to Modeling and Decision Analysis78 Questions
Exam 2: Introduction to Optimization and Linear Programming76 Questions
Exam 3: Modeling and Solving Lp Problems in a Spreadsheet93 Questions
Exam 4: Sensitivity Analysis and the Simplex Method76 Questions
Exam 5: Network Modeling92 Questions
Exam 6: Integer Linear Programming102 Questions
Exam 7: Goal Programming and Multiple Objective Optimization81 Questions
Exam 8: Nonlinear Programming Evolutionary Optimization87 Questions
Exam 9: Regression Analysis93 Questions
Exam 10: Data Mining125 Questions
Exam 11: Time Series Forecasting125 Questions
Exam 12: Introduction to Simulation Using Analytic Solver Platform85 Questions
Exam 13: Queuing Theory97 Questions
Exam 14: Decision Analysis125 Questions
Exam 15: Project Management Online82 Questions
Select questions type
Common continuous distributions available in Analytic Solver Platform are
(Multiple Choice)
4.9/5  (34)
(34)
Exhibit 12.2
The following questions use the information below.
The owner of Fix-a-dent Auto Repair wants to study the growth of his business using simulation. He is interested in simulating the number of damaged cars and the amount of damage to the cars each month. He currently repairs 100 cars per month and feels the change in number of cars can vary uniformly between a decrease of as much as 3% and an increase of up to 5% (average change of 1%). The dollar value of the damage to the cars is a normally distributed random variable with a mean of $3,000 and a standard deviation of $500. The average repair bill has been increasing steadily over the years and the owner expects the mean repair bill will increase by 1% per month. A spreadsheet model to simulate the problem has been run 300 times. A part of the simulation statistics output from Risk Solver Platform (RSP)and a spreadsheet for computing confidence intervals follows. 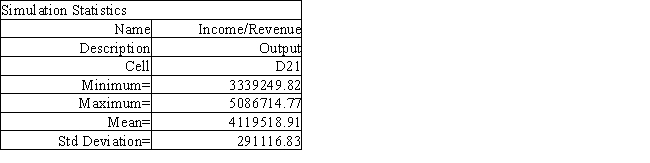
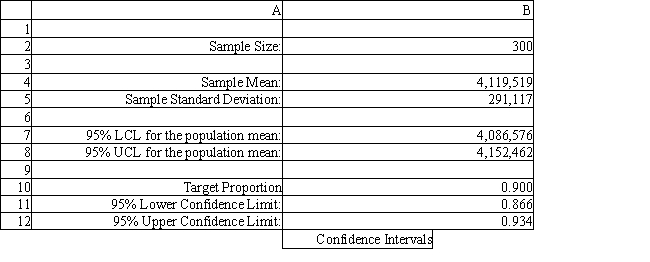 -Using the information in Exhibit 12.2, what formula should go in cell B12 of the Confidence Intervals spreadsheet to compute the upper limit on a 95% confidence interval for the population proportion below 90%?
(Multiple Choice)
4.7/5 (29)
Exhibit 12.5
The following questions use the information below.
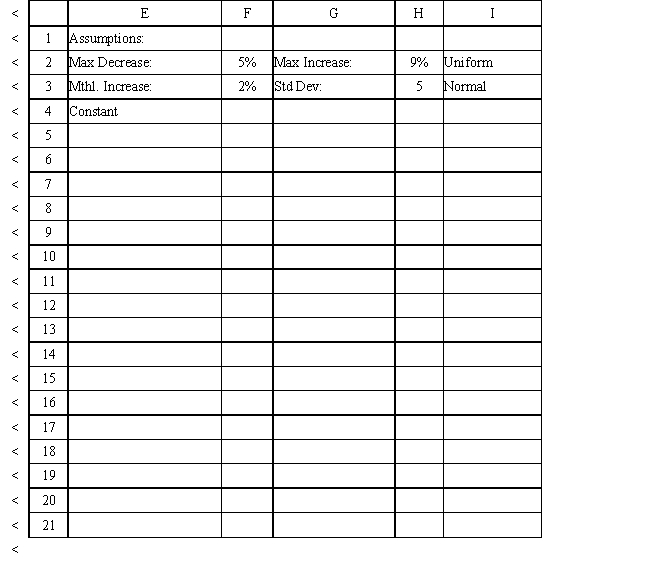
The owner of Sal's Italian Restaurant wants to study the growth of his business using simulation. He is interested in simulating the number of customers and the amount ordered by customers each month. He currently serves 1000 customers per month and feels this can vary uniformly between a decrease of as much as 5% and an increase of up to 9%. The bill for each customer is a normally distributed random variable with a mean of $20 and a standard deviation of $5. The average order has been increasing steadily over the years and the owner expects the mean order will increase by 2% per month. You have created the following spreadsheet to simulate the problem. 
 -What function should be used for generating random numbers from a normal distribution with mean μ and standard deviation σ?
(Short Answer)
4.9/5 (30)
Exhibit 12.5
The following questions use the information below.
The owner of Sal's Italian Restaurant wants to study the growth of his business using simulation. He is interested in simulating the number of customers and the amount ordered by customers each month. He currently serves 1000 customers per month and feels this can vary uniformly between a decrease of as much as 5% and an increase of up to 9%. The bill for each customer is a normally distributed random variable with a mean of $20 and a standard deviation of $5. The average order has been increasing steadily over the years and the owner expects the mean order will increase by 2% per month. You have created the following spreadsheet to simulate the problem. 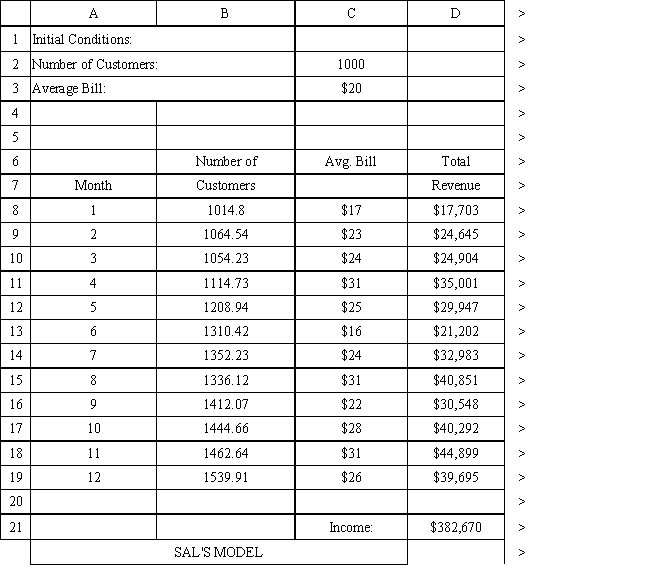
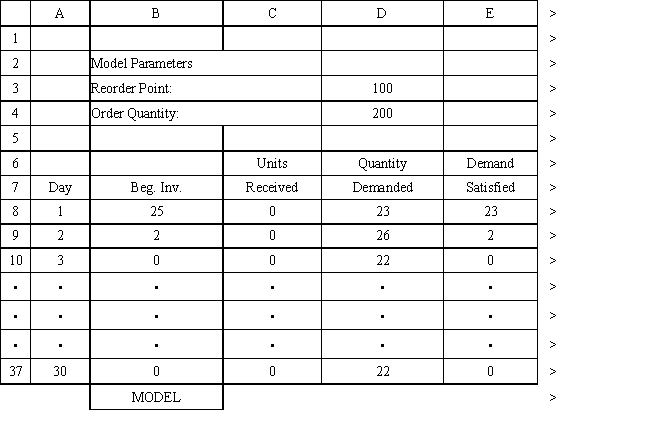
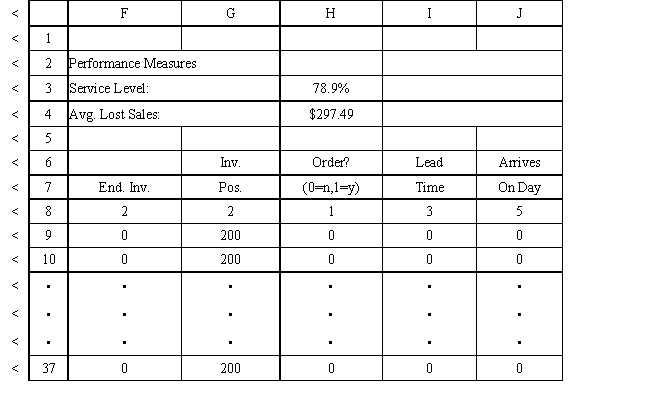
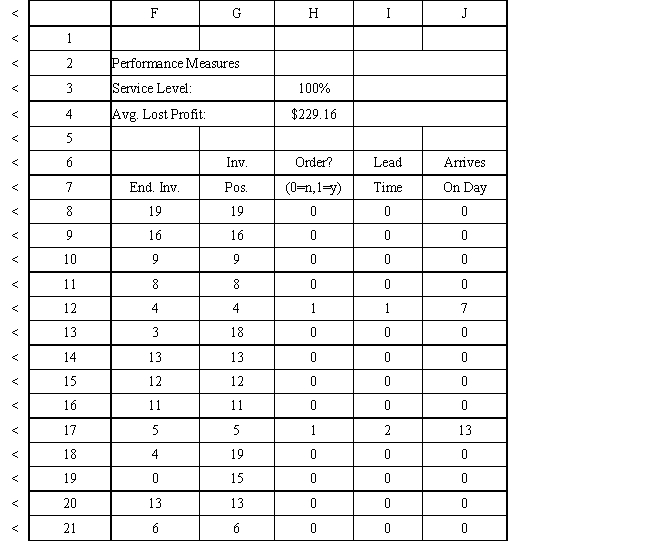
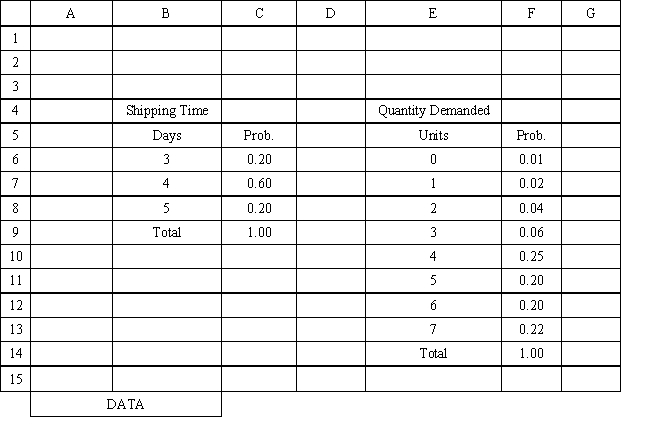
 -An office supply store wants to simulate its inventory system for notebooks. The company has collected data on the shipping time and daily demand for notebooks. Each notebook generates a $2 profit. Customers can buy notebooks at any office supply store so there are no backorders (the company loses the sale and profit). The company orders 200 notebooks whenever the inventory position falls below the reorder point of 100 notebooks. Orders are placed at the beginning of the day and delivered at the beginning of the day so the notebooks are available on the arrival day. The average daily demand is 23.5 notebooks. An average service level of 99% is desired. There are currently 25 notebooks on hand and no orders are pending. The following spreadsheets have been developed for this problem. The company has simulated 1 month of operation for its inventory system. (HINT: This covers Rows 8 to 37 of the spreadsheet.) What formulas go in cells A1:J37 of the "Model" worksheet for this simulation?
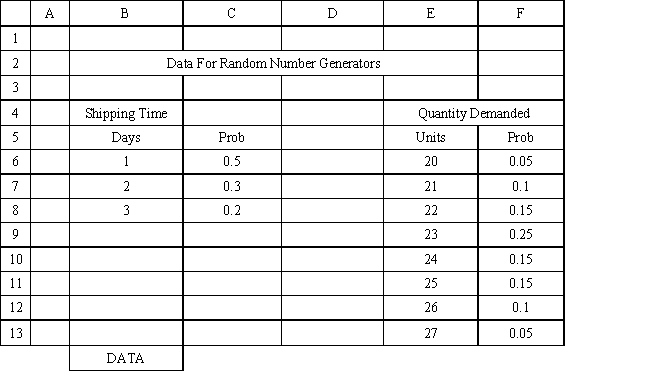
(Essay)
4.8/5 (39)
Exhibit 12.5
The following questions use the information below.
The owner of Sal's Italian Restaurant wants to study the growth of his business using simulation. He is interested in simulating the number of customers and the amount ordered by customers each month. He currently serves 1000 customers per month and feels this can vary uniformly between a decrease of as much as 5% and an increase of up to 9%. The bill for each customer is a normally distributed random variable with a mean of $20 and a standard deviation of $5. The average order has been increasing steadily over the years and the owner expects the mean order will increase by 2% per month. You have created the following spreadsheet to simulate the problem. 
 -What is the expected number of phone calls per hour based on the following distribution on the number of phone calls per hour?
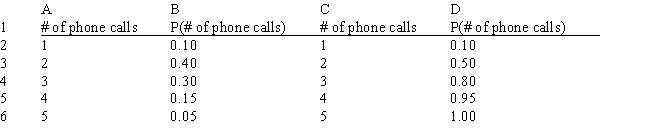
(Essay)
4.7/5 (40)
Exhibit 12.4.
The following questions use the information below.
The manager of a Washington, DC sightseeing tour company is concerned about overbooking for one of his bus tours. The bus has 15 seats but sometimes there are empty seats. His records show that about 20% of ticket holders do not show up for their tour. Tickets cost $10 and are non-refundable. If the manager overbooks the tour and more than 15 passengers show up, some of them will be bumped to a later tour. This bumping costs the company $25 in various expenses to keep the customer happy until the next tour. The manager wants to see what happens to profits if 18 reservations are accepted. 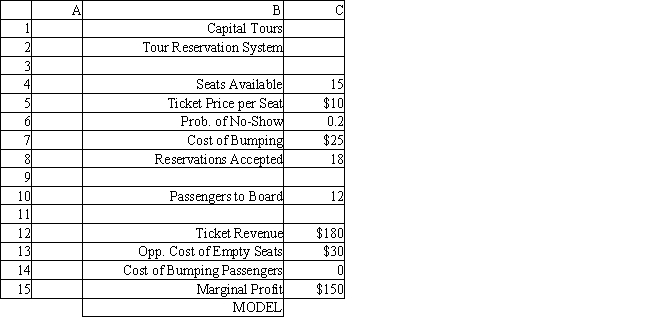 -Using the information in Exhibit 12.4, what formula should go in cell C13 of the worksheet to determine the Opportunity Cost of Empty Seats?
(Multiple Choice)
4.7/5 (33)
Exhibit 12.3
The following questions use the information below.
An auto parts store wants to simulate its inventory system for engine oil. The company has collected data on the shipping time for oil and the daily demand for cases of oil. A case of oil generates a $10 profit. Customers can buy oil at any auto parts store so there are no backorders (the company loses the sale and profit). The company orders 30 cases whenever the inventory position falls below the reorder point of 15 cases. Orders are placed at the beginning of the day and delivered at the beginning of the day so the oil is available on the arrival day. An average service level of 99% is desired. The following spreadsheets have been developed for this problem. The company has simulated 2 weeks of operation for their inventory system. The current level of on-hand inventory is 25 units and no orders are pending. 

 -A variable whose value cannot be predicted or set with certainty is a
(Multiple Choice)
4.8/5 (46)
Exhibit 12.3
The following questions use the information below.
An auto parts store wants to simulate its inventory system for engine oil. The company has collected data on the shipping time for oil and the daily demand for cases of oil. A case of oil generates a $10 profit. Customers can buy oil at any auto parts store so there are no backorders (the company loses the sale and profit). The company orders 30 cases whenever the inventory position falls below the reorder point of 15 cases. Orders are placed at the beginning of the day and delivered at the beginning of the day so the oil is available on the arrival day. An average service level of 99% is desired. The following spreadsheets have been developed for this problem. The company has simulated 2 weeks of operation for their inventory system. The current level of on-hand inventory is 25 units and no orders are pending.
-Jim Johnson operates a bus service to take college students to "The Big City" on Friday night and bring them back to school on Sunday night. The bus has 45 seats but sometimes there are empty seats. His records show that about 5% of ticket holders do not show up for their ride. Tickets cost $20 and are non-refundable. If Jim overbooks the bus and more than 45 passengers show up, some of them will be bumped and have to miss the trip. This bumping costs the company $40 because Jim has a double-your-money back policy for bumped passengers. Jim wants to see what happens to profits if 48 reservations are accepted. 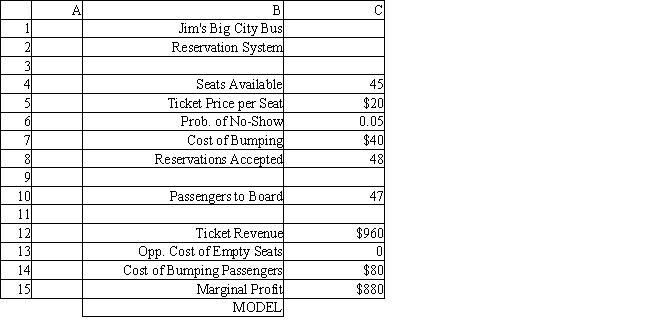 What formulas should go in cell C10 − C15 of the worksheet?
(Essay)
4.8/5 (26)
Exhibit 12.5
The following questions use the information below.
The owner of Sal's Italian Restaurant wants to study the growth of his business using simulation. He is interested in simulating the number of customers and the amount ordered by customers each month. He currently serves 1000 customers per month and feels this can vary uniformly between a decrease of as much as 5% and an increase of up to 9%. The bill for each customer is a normally distributed random variable with a mean of $20 and a standard deviation of $5. The average order has been increasing steadily over the years and the owner expects the mean order will increase by 2% per month. You have created the following spreadsheet to simulate the problem.
-The spreadsheet model for Sal, from Exhibit 12.5, has been run 300 times to produce the following output. What is the best case scenario for Sal based on this output? 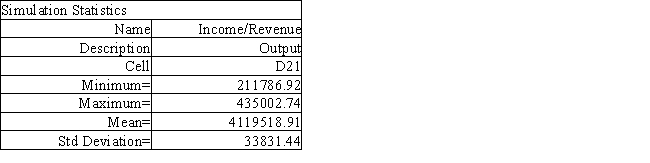 Instructions: Answer the following questions using the Analytic Solver Platform Excel add-in.
(Short Answer)
5.0/5 (38)
Exhibit 12.3
The following questions use the information below.
An auto parts store wants to simulate its inventory system for engine oil. The company has collected data on the shipping time for oil and the daily demand for cases of oil. A case of oil generates a $10 profit. Customers can buy oil at any auto parts store so there are no backorders (the company loses the sale and profit). The company orders 30 cases whenever the inventory position falls below the reorder point of 15 cases. Orders are placed at the beginning of the day and delivered at the beginning of the day so the oil is available on the arrival day. An average service level of 99% is desired. The following spreadsheets have been developed for this problem. The company has simulated 2 weeks of operation for their inventory system. The current level of on-hand inventory is 25 units and no orders are pending. 

 -Using the information in Exhibit 12.3, what formula should go in cell C9 and copied to C10:C21 of the MODEL sheet to compute units received?
(Multiple Choice)
4.8/5 (36)
Exhibit 12.3
The following questions use the information below.
An auto parts store wants to simulate its inventory system for engine oil. The company has collected data on the shipping time for oil and the daily demand for cases of oil. A case of oil generates a $10 profit. Customers can buy oil at any auto parts store so there are no backorders (the company loses the sale and profit). The company orders 30 cases whenever the inventory position falls below the reorder point of 15 cases. Orders are placed at the beginning of the day and delivered at the beginning of the day so the oil is available on the arrival day. An average service level of 99% is desired. The following spreadsheets have been developed for this problem. The company has simulated 2 weeks of operation for their inventory system. The current level of on-hand inventory is 25 units and no orders are pending. 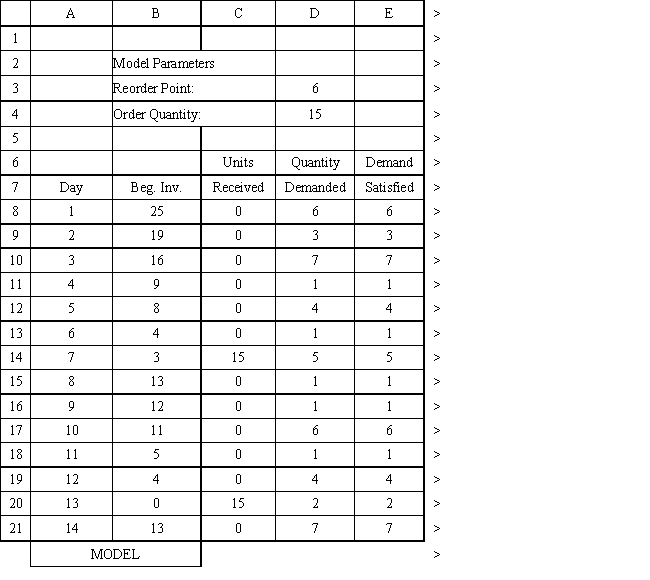

 -Using the information in Exhibit 12.3, what formula should go in cell H3 to compute the service level?
(Multiple Choice)
4.9/5 (35)
Exhibit 12.5
The following questions use the information below.
The owner of Sal's Italian Restaurant wants to study the growth of his business using simulation. He is interested in simulating the number of customers and the amount ordered by customers each month. He currently serves 1000 customers per month and feels this can vary uniformly between a decrease of as much as 5% and an increase of up to 9%. The bill for each customer is a normally distributed random variable with a mean of $20 and a standard deviation of $5. The average order has been increasing steadily over the years and the owner expects the mean order will increase by 2% per month. You have created the following spreadsheet to simulate the problem.
-Sal, from Exhibit 12.5, has produced the following spreadsheet to compute confidence intervals on his income. What formula should go in cell B12 to compute the upper limit on a 95% confidence interval for the population proportion below 90%? 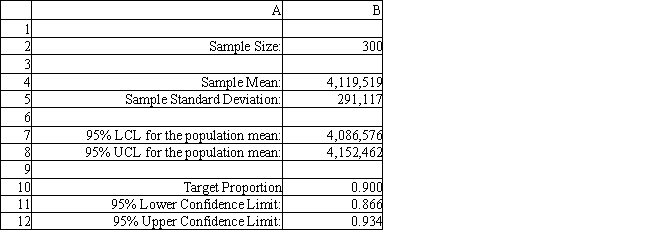 Instructions: Answer the following questions using the Analytic Solver Platform Excel add-in.
(Short Answer)
5.0/5 (38)
Exhibit 12.3
The following questions use the information below.
An auto parts store wants to simulate its inventory system for engine oil. The company has collected data on the shipping time for oil and the daily demand for cases of oil. A case of oil generates a $10 profit. Customers can buy oil at any auto parts store so there are no backorders (the company loses the sale and profit). The company orders 30 cases whenever the inventory position falls below the reorder point of 15 cases. Orders are placed at the beginning of the day and delivered at the beginning of the day so the oil is available on the arrival day. An average service level of 99% is desired. The following spreadsheets have been developed for this problem. The company has simulated 2 weeks of operation for their inventory system. The current level of on-hand inventory is 25 units and no orders are pending. 
 -Why would a manager be interested in analyzing risk?
(Multiple Choice)
4.8/5 (37)
Using the information in Exhibit 12.3, what Analytic Solver Platform function should be used in cell D8 and copied to cells D9:D21 of the MODEL sheet to compute daily demand?
(Multiple Choice)
4.8/5 (32)
Exhibit 12.2
The following questions use the information below.
The owner of Fix-a-dent Auto Repair wants to study the growth of his business using simulation. He is interested in simulating the number of damaged cars and the amount of damage to the cars each month. He currently repairs 100 cars per month and feels the change in number of cars can vary uniformly between a decrease of as much as 3% and an increase of up to 5% (average change of 1%). The dollar value of the damage to the cars is a normally distributed random variable with a mean of $3,000 and a standard deviation of $500. The average repair bill has been increasing steadily over the years and the owner expects the mean repair bill will increase by 1% per month. A spreadsheet model to simulate the problem has been run 300 times. A part of the simulation statistics output from Risk Solver Platform (RSP)and a spreadsheet for computing confidence intervals follows. 
 -Using the information in Exhibit 12.2, what is the worst case scenario for the Fix-a-dent company based on this output?
(Multiple Choice)
4.9/5 (41)
One of Analytic Solver Platform's amazing capabilities is its ability to perform interactive simulation.
(True/False)
4.8/5 (35)
As the number of replicates in a simulation increases the width of a confidence interval computed from the simulation results will
(Multiple Choice)
4.8/5 (32)
The educational version of Analytic Solver Platform has no limit on the number of trials per simulation.
(True/False)
4.9/5 (36)
Filters
- Essay(0)
- Multiple Choice(0)
- Short Answer(0)
- True False(0)
- Matching(0)