Exam 10: Data Mining
Exam 1: Introduction to Modeling and Decision Analysis78 Questions
Exam 2: Introduction to Optimization and Linear Programming76 Questions
Exam 3: Modeling and Solving Lp Problems in a Spreadsheet93 Questions
Exam 4: Sensitivity Analysis and the Simplex Method76 Questions
Exam 5: Network Modeling92 Questions
Exam 6: Integer Linear Programming102 Questions
Exam 7: Goal Programming and Multiple Objective Optimization81 Questions
Exam 8: Nonlinear Programming Evolutionary Optimization87 Questions
Exam 9: Regression Analysis93 Questions
Exam 10: Data Mining125 Questions
Exam 11: Time Series Forecasting125 Questions
Exam 12: Introduction to Simulation Using Analytic Solver Platform85 Questions
Exam 13: Queuing Theory97 Questions
Exam 14: Decision Analysis125 Questions
Exam 15: Project Management Online82 Questions
Select questions type
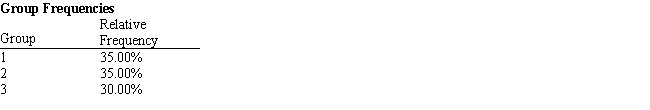
Exhibit 10.2
The following questions are based on the problem description and the output below.
A college admissions officer wants to evaluate graduate school applicants based on their GMAT scores, verbal and quantitative. Students are classified as either successful (Group 1), marginally successful (Group 2) or not-successful (Group 3) in their graduate studies. The officer has data on 20 current students, 7 successful (Group 1), 6 marginally successful (Group 2) and 7 not successful (Group 3). 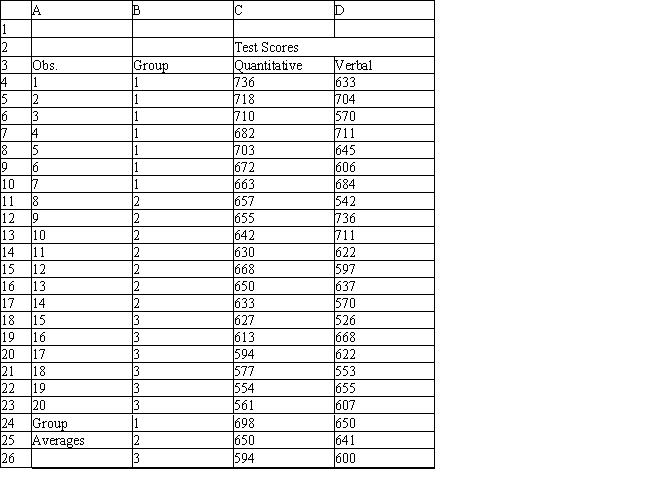

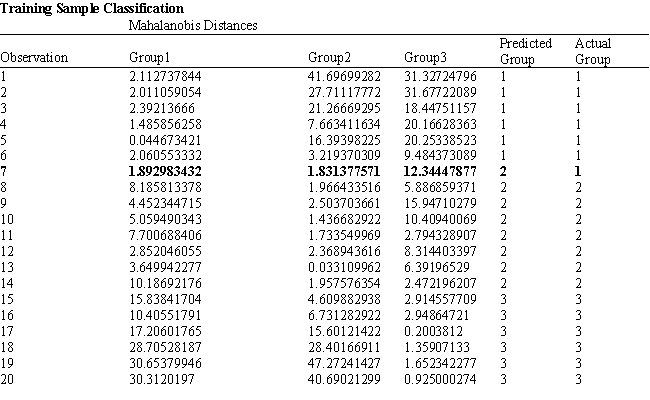
 -Refer to Exhibit 10.2. What is the quantitative test score value of the group centroid for group 2?
Free
(Multiple Choice)
4.9/5  (34)
(34)
Correct Answer: Verified
B
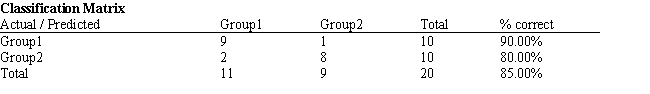
Exhibit 10.2
The following questions are based on the problem description and the output below.
A college admissions officer wants to evaluate graduate school applicants based on their GMAT scores, verbal and quantitative. Students are classified as either successful (Group 1), marginally successful (Group 2) or not-successful (Group 3) in their graduate studies. The officer has data on 20 current students, 7 successful (Group 1), 6 marginally successful (Group 2) and 7 not successful (Group 3). 


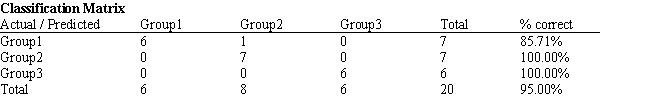 -Refer to Exhibit 10.2. What number of observations is classified incorrectly?
Free
(Multiple Choice)
4.8/5 (36)
Correct Answer:Verified
D
Data mining tasks fall into three potential categories: Classification, Prediction and Association/Segmentation.
Free
(True/False)
4.8/5 (24)
Correct Answer:Verified
True
The Get Data command is part of the XLMiner Platform in Excel add-on.
(True/False)
4.9/5 (36)
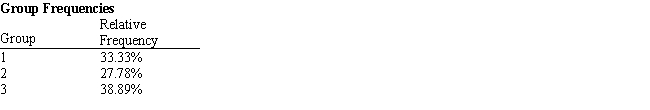
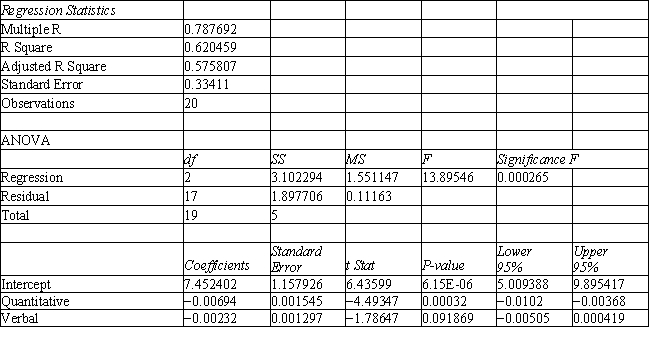
Exhibit 10.7
The information below is used for the following questions.
An investor wants to classify companies as being a High Risk Investment, Group 1, a Medium Risk Investment, Group 2, or a Low Risk Investment, Group 3. He has gathered Liquidity, Profitability data on 18 companies he has invested in and produced the following spreadsheet. The following Discriminant Analysis output using Analytic Solver Platform has also been generated. 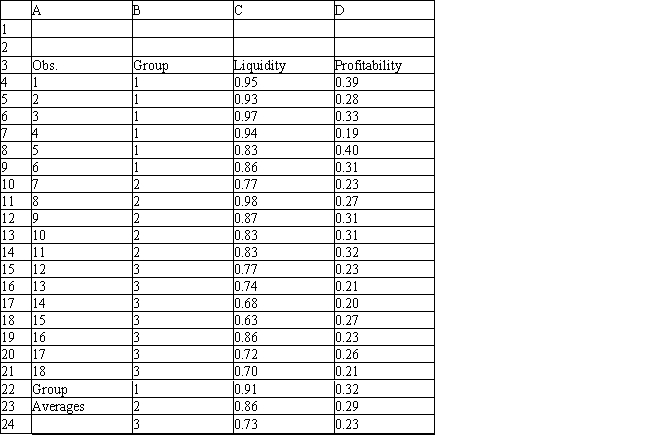
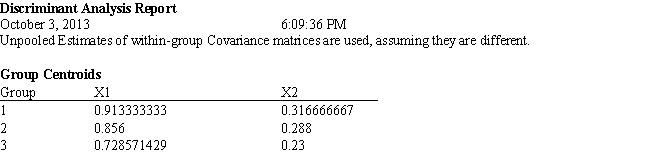
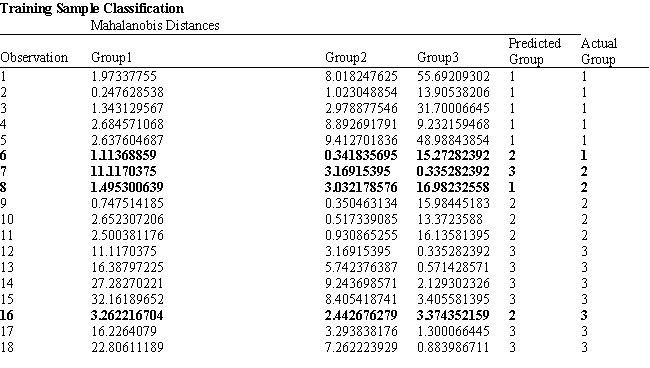
 -Refer to Exhibit 10.7. What formulas should go in cells C22:D24 of the spreadsheet?
(Essay)
4.8/5 (35)
A graphical representation of clustering outcomes showing which items should be classified to which clusters is called a(n)
(Multiple Choice)
4.8/5 (25)
Useful data mining techniques can be found in Excel under ___________ drop menu
(Multiple Choice)
4.8/5 (32)
Affinity analysis is a data mining technique used in marketing research to determine
(Multiple Choice)
4.7/5 (32)
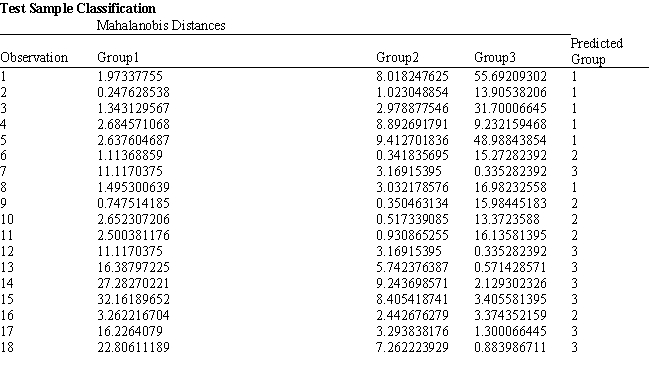
Exhibit 10.1
The following questions are based on the problem description and the output below.
A college admissions officer wants to evaluate graduate school applicants based on their GMAT scores, verbal and quantitative. Students are classified as either successful or not-successful in their graduate studies. The officer has data on 20 current students, ten of whom are doing very well (Group 1) and ten who are not (Group 2). 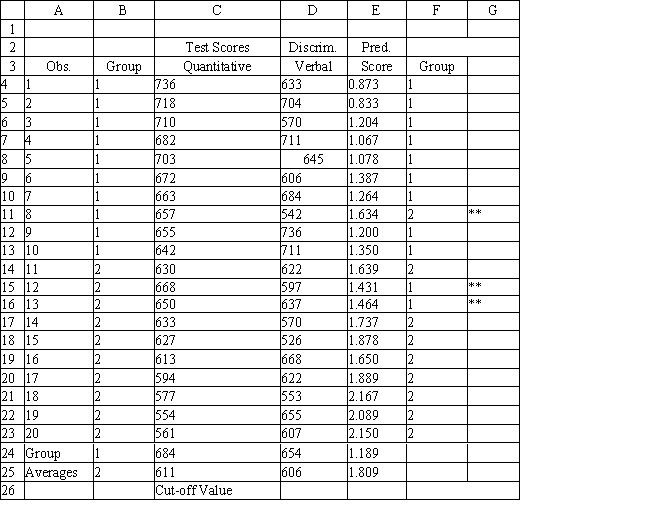


 -Refer to Exhibit 10.1. The straight line distance between two points (X1, Y1) and (X2, Y2) is calculated as
(Multiple Choice)
4.8/5 (43)
Suppose that two variables are found to be significantly correlated. A researcher may
(Multiple Choice)
4.9/5 (37)
In the ________ step of data mining, a researcher attempts to estimate to which discrete group an observation belongs to
(Multiple Choice)
4.9/5 (29)
Exhibit 10.2
The following questions are based on the problem description and the output below.
A college admissions officer wants to evaluate graduate school applicants based on their GMAT scores, verbal and quantitative. Students are classified as either successful (Group 1), marginally successful (Group 2) or not-successful (Group 3) in their graduate studies. The officer has data on 20 current students, 7 successful (Group 1), 6 marginally successful (Group 2) and 7 not successful (Group 3). 
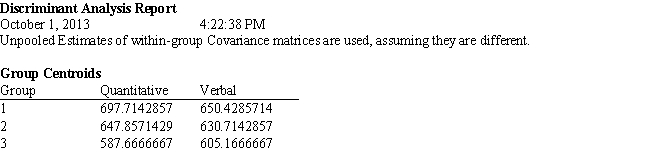

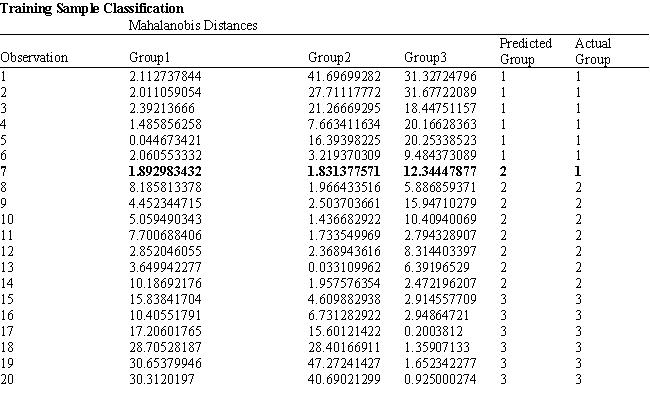
 -Refer to Exhibit 10.2. What percentage of observations is classified correctly?
(Multiple Choice)
4.8/5 (39)
____________ is a classification technique that estimates the probability of an observation belonging to a particular group
(Multiple Choice)
4.9/5 (31)
Exhibit 10.1
The following questions are based on the problem description and the output below.
A college admissions officer wants to evaluate graduate school applicants based on their GMAT scores, verbal and quantitative. Students are classified as either successful or not-successful in their graduate studies. The officer has data on 20 current students, ten of whom are doing very well (Group 1) and ten who are not (Group 2). 
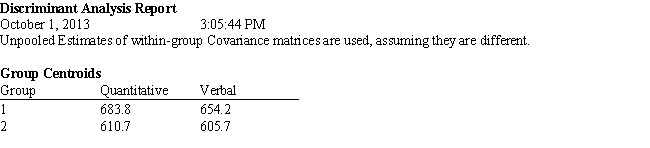

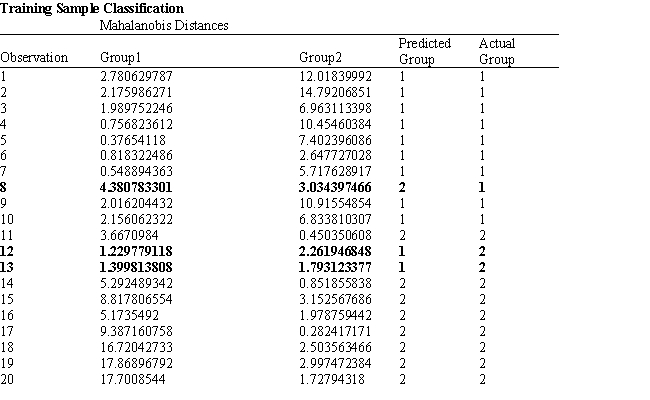 -Refer to Exhibit 10.1. Suppose that for a given observation, the difference between Mahalanobis distances between group 1 and 2 (G1-G2) is small. This means that
(Multiple Choice)
4.7/5 (34)
In the ________ step of data mining, a researcher attempts to form logical groupings of data in the set
(Multiple Choice)
4.8/5 (29)
Filters
- Essay(0)
- Multiple Choice(0)
- Short Answer(0)
- True False(0)
- Matching(0)