Exam 9: Regression Analysis
Exam 1: Introduction to Modeling and Decision Analysis78 Questions
Exam 2: Introduction to Optimization and Linear Programming76 Questions
Exam 3: Modeling and Solving Lp Problems in a Spreadsheet93 Questions
Exam 4: Sensitivity Analysis and the Simplex Method76 Questions
Exam 5: Network Modeling92 Questions
Exam 6: Integer Linear Programming102 Questions
Exam 7: Goal Programming and Multiple Objective Optimization81 Questions
Exam 8: Nonlinear Programming Evolutionary Optimization87 Questions
Exam 9: Regression Analysis93 Questions
Exam 10: Data Mining125 Questions
Exam 11: Time Series Forecasting125 Questions
Exam 12: Introduction to Simulation Using Analytic Solver Platform85 Questions
Exam 13: Queuing Theory97 Questions
Exam 14: Decision Analysis125 Questions
Exam 15: Project Management Online82 Questions
Select questions type
What is a clear indicator of non-constant variance in a plot of regression model residuals?
Free
(Multiple Choice)
4.9/5  (35)
(35)
Correct Answer: Verified
C
The regression residuals are computed as
Free
(Multiple Choice)
4.9/5 (36)
Correct Answer:Verified
C
Based on the following regression output, what is the equation of the regression line? 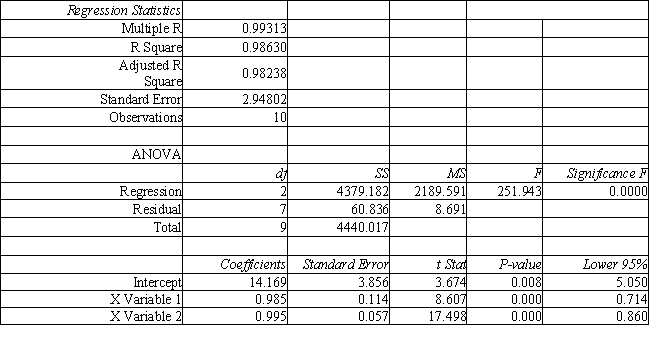
Free
(Multiple Choice)
4.8/5 (31)
Correct Answer:Verified
A
An analyst has identified 3 independent variables (X1, X2, X3) which might be used to predict Y. He has computed the regression equations using all combinations of the variables and the results are summarized in the following table. Why is the R2 value for the X3 model the same as the R2 value for the X1 and X3 model, but the Adjusted R2 values differ? 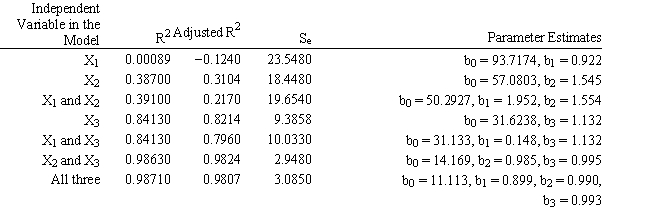
(Multiple Choice)
4.9/5 (30)
Based on the following regression output, what conclusion can you reach about β0? 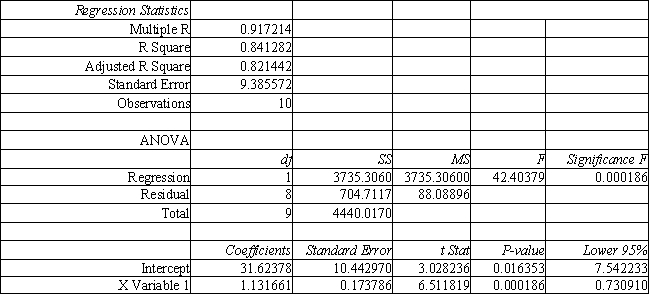
(Multiple Choice)
4.9/5 (39)
Exhibit 9.1
The following questions are based on the problem description and spreadsheet below.
A company has built a regression model to predict the number of labor hours (Yi) required to process a batch of parts (Xi). It has developed the following Excel spreadsheet of the results.  -Refer to Exhibit 9.1. Interpret the meaning of the "Lower 95%" and "Upper 95%" terms in cells F16:G16 of the spreadsheet.
(Essay)
4.8/5 (40)
A simple linear regression model is of the form: Yi = + 1X1i + i
(True/False)
4.8/5 (36)
You want to conduct a hypothesis test for β1. Based on the following regression output, what conclusion can you reach about β1? 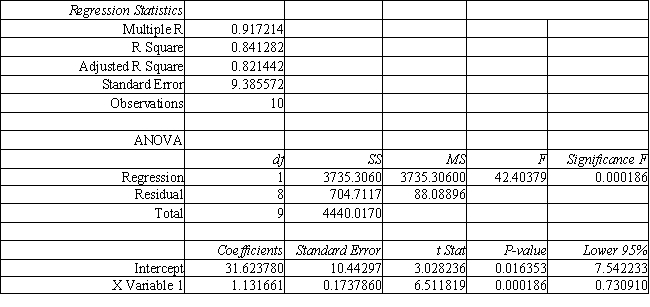
(Multiple Choice)
4.8/5 (30)
Exhibit 9.7
The partial regression output below applies to the following questions. 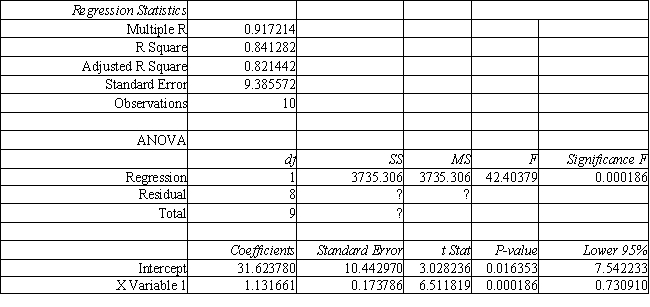 -Refer to Exhibit 9.7. What is the SS for Total?
(Short Answer)
4.7/5 (32)
The R2 statistic (also referred to as the coefficient of determination) ranges in value from 0 to 1 (0 R2 1) and indicates the proportion of the total variation in the dependent variable Y around its mean (average) that is accounted for by the independent variable(s) in the estimated regression function.
(True/False)
4.7/5 (40)
Exhibit 9.1
The following questions are based on the problem description and spreadsheet below.
A company has built a regression model to predict the number of labor hours (Yi) required to process a batch of parts (Xi). It has developed the following Excel spreadsheet of the results. 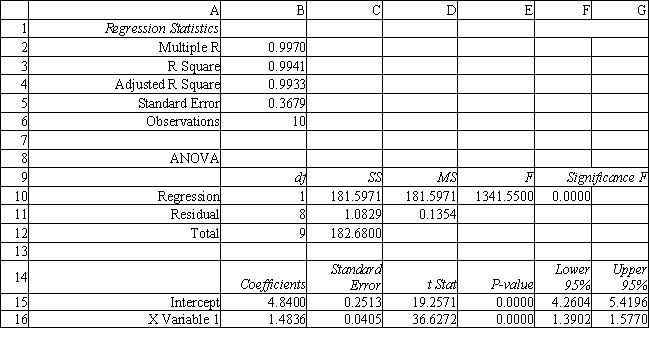 -Refer to Exhibit 9.1. Predict the mean number of labor hours for a batch of 5 parts.
(Essay)
4.7/5 (28)
Based on the following regression output, what proportion of the total variation in Y is explained by X? 
(Multiple Choice)
4.8/5 (38)
Exhibit 9.2
The following questions are based on the problem description and spreadsheet below.
A paint manufacturer is interested in knowing how much pressure (in pounds per square inch, PSI) builds up inside aerosol cans at various temperatures (degrees Fahrenheit). It has developed the following Excel spreadsheet of the results. 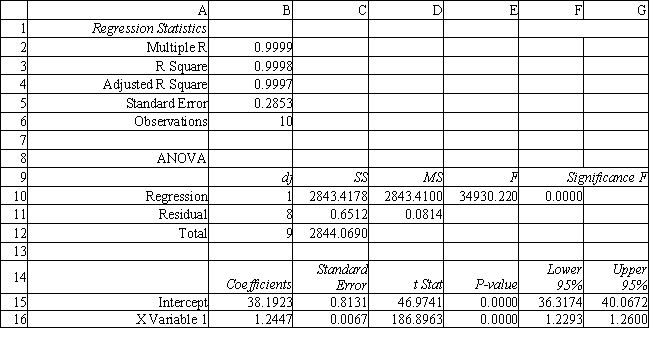 -Refer to Exhibit 9.2. Test the significance of the model and explain which values you used to reach your conclusions.
(Essay)
4.8/5 (33)
Exhibit 9.3
The following questions are based on the problem description and spreadsheet below.
A researcher is interested in determining how many calories young men consume. She measured the age of the individuals and recorded how much food they ate each day for a month. The average daily consumption was recorded as the dependent variable. She has developed the following Excel spreadsheet of the results. 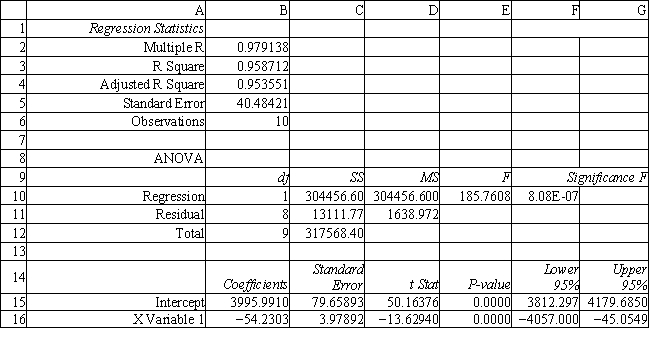 -Refer to Exhibit 9.3. Interpret the meaning of R square in cell B3 of the spreadsheet.
(Essay)
4.8/5 (40)
A residual is defined as the difference between the fitted value based on a model and a corresponding actual value.
(True/False)
4.9/5 (34)
Exhibit 9.7
The partial regression output below applies to the following questions.
-Refer to Exhibit 9.7. What is the SS for Residual and MS for Residual?
(Essay)
4.7/5 (29)
Filters
- Essay(0)
- Multiple Choice(0)
- Short Answer(0)
- True False(0)
- Matching(0)