Exam 11: Two-Sample Tests of Hypothesis
Exam 1: What Is Statistics79 Questions
Exam 2: Describing Data: Frequency Tables, Frequency Distributions, and Graphic Presentation129 Questions
Exam 3: Describing Data: Numerical Measures117 Questions
Exam 4: Describing Data: Displaying and Exploring Data92 Questions
Exam 5: A Survey of Probability Concepts121 Questions
Exam 6: Discrete Probability Distributions114 Questions
Exam 7: Continuous Probability Distributions100 Questions
Exam 8: Sampling Methods and the Central Limit Theorem114 Questions
Exam 9: Estimation and Confidence Intervals114 Questions
Exam 10: One-Sample Tests of Hypothesis129 Questions
Exam 11: Two-Sample Tests of Hypothesis122 Questions
Exam 12: Analysis of Variance92 Questions
Exam 13: Correlation and Linear Regression130 Questions
Exam 14: Multiple Regression Analysis122 Questions
Exam 15: Nonparametric Methods: Goodness-Of-Fit Tests128 Questions
Select questions type
An investigation of the effectiveness of a training program to improve customer relationships included a pre-training and post-training customer survey. To compare the differences they computed (post-training survey score - pre-training survey score). Seven customers were randomly selected and completed both surveys. The results follow. 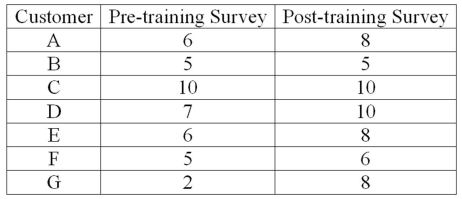 For a 0.05 significance level, what is the decision regarding the hypothesis that the training was effective in improving customer relationships?
(Multiple Choice)
4.9/5  (43)
(43)
A recent study focused on the number of times men and women send a Twitter message in a day. The sample information is summarized below. 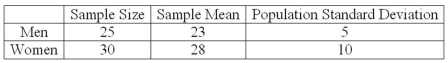 At the .01 significance level, is there a difference in the mean number of times men and women send a Twitter message in a day? What is the test statistic for this hypothesis?
(Multiple Choice)
4.8/5 (33)
An investigation of the effectiveness of a training program to improve customer relationships included a pre-training and post-training customer survey. To compare the differences they computed (post-training survey score - pre-training survey score). Seven customers were randomly selected and completed both surveys. The results follow. 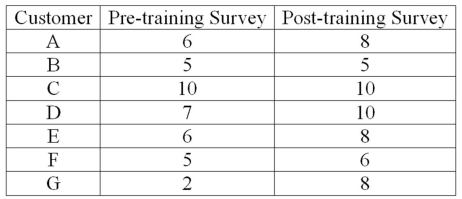 What is the value of the test statistic?
(Multiple Choice)
4.8/5 (35)
The results of a mathematics placement exam at two different campuses of Mercy College follow: 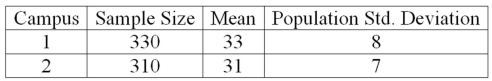 What is the computed value of the test statistic?
(Multiple Choice)
5.0/5 (29)
For hypotheses that compare two population means, when is a pooled variance used?
(Essay)
4.7/5 (31)
To compare the effect of weather on sales of soft drinks, a distributor surveyed people in two regions of the country and asked if they purchased soft drinks in the last month. The following are the results. The distributor would like to know if there is a difference in sales between the two regions. 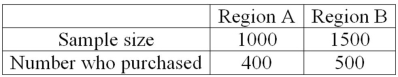 What is the pooled estimate of the population proportion?
(Short Answer)
4.9/5 (37)
For hypotheses that compare two population means, what test statistic is used when the population standard deviations are unknown?
(Short Answer)
4.7/5 (37)
A company is researching the effectiveness of a new website design to decrease the time to access a website. Five website users were randomly selected, and their times (in seconds) to access the website with the old and new designs were recorded. To compare the times, they computed (new website design time - old website design time). The results follow.  What is the value of the test statistic?
(Multiple Choice)
4.7/5 (38)
When testing the difference between two dependent population means, the test statistic is based on a ______________.
(Multiple Choice)
5.0/5 (27)
If the decision is to reject the null hypothesis of no difference between two population proportions at the 5% level of significance, what are the alternative hypothesis and rejection region?
(Multiple Choice)
4.8/5 (34)
We test for a hypothesized difference between two population means: H0: μ1 = μ2. The population standard deviations are unknown but assumed equal. The number of observations in the first sample is 15, and 12 in the second sample. How many degrees of freedom are associated with the critical value?
(Multiple Choice)
4.9/5 (35)
To compare the effect of weather on sales of soft drinks, a distributor surveyed people in two regions of the country and asked if they purchased soft drinks in the last month. The following are the results. The distributor would like to know if there is a difference in sales between the two regions? 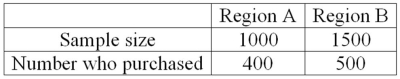 What is the proportion of people who purchased soda in Region A?
(Short Answer)
4.7/5 (32)
To compare the effect of weather on sales of soft drinks, a distributor surveyed people in two regions of the country and asked if they purchased soft drinks in the last month. The following are the results. The distributor would like to know if there is a difference in sales between the two regions. 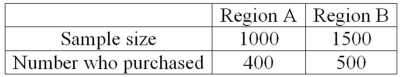 What is the null hypothesis?
(Short Answer)
4.9/5 (31)
A statistics professor wants to compare grades in two different classes of the same course. This is an example of a paired sample.
(True/False)
4.8/5 (31)
The purpose of pooling the sample proportions when testing the difference between two population proportions is to ___________.
(Short Answer)
4.8/5 (34)
What is the critical value of t for the claim that the difference of two means is less than zero with α = 0.025 and sample sizes of nine and seven? Assume equal population standard deviations.
(Short Answer)
4.8/5 (34)
The results of a mathematics placement exam at two different campuses of Mercy College follow: 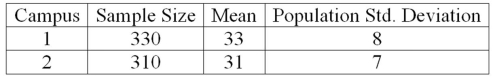 What is the null hypothesis if we want to test the hypothesis that the mean score on Campus 1 is higher than on Campus 2?
(Multiple Choice)
4.8/5 (41)
For a hypothesis test comparing two population means, the combined degrees of freedom are 24. Which of the following statements about the two sample sizes is NOT true? Assume the population standard deviations are equal.
(Multiple Choice)
4.8/5 (34)
Accounting procedures allow a business to evaluate its inventory costs based on two methods: LIFO (Last In First Out) or FIFO (First In First Out). A manufacturer evaluated its finished goods inventory (in $000s) for five products with the LIFO and FIFO methods. To analyze the difference, they computed (FIFO - LIFO) for each product. Based on the following results, does the LIFO method result in a lower cost of inventory than the FIFO method? 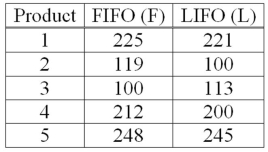 This example is what type of test?
(Multiple Choice)
4.9/5 (33)
If the null hypothesis states that there is no difference between the two population means, then the test is ______________.
(Short Answer)
4.9/5 (34)
Filters
- Essay(0)
- Multiple Choice(0)
- Short Answer(0)
- True False(0)
- Matching(0)