Exam 5: Elasticity and Its Application
Exam 1: Ten Principles of Economics438 Questions
Exam 2: Thinking Like an Economist620 Questions
Exam 3: Interdependence and the Gains From Trade527 Questions
Exam 4: The Market Forces of Supply and Demand700 Questions
Exam 5: Elasticity and Its Application598 Questions
Exam 6: Supply, Demand, and Government Policies648 Questions
Exam 7: Consumers, Producers, and the Efficiency of Markets550 Questions
Exam 8: Application: The Costs of Taxation514 Questions
Exam 9: Application: International Trade496 Questions
Exam 10: Externalities522 Questions
Exam 11: Public Goods and Common Resources434 Questions
Exam 12: The Costs of Production420 Questions
Exam 13: Firms in Competitive Markets543 Questions
Exam 14: Monopoly637 Questions
Exam 15: Measuring a Nations Income522 Questions
Exam 16: Measuring the Cost of Living545 Questions
Exam 17: Production and Growth507 Questions
Exam 18: Saving, Investment, and the Financial System567 Questions
Exam 19: The Basic Tools of Finance513 Questions
Exam 20: Unemployment699 Questions
Exam 21: The Monetary System518 Questions
Exam 22: Money Growth and Inflation487 Questions
Exam 23: Aggregate Demand and Aggregate Supply563 Questions
Exam 24: The Influence of Monetary and Fiscal Policy on Aggregate Demand512 Questions
Select questions type
Figure 5-15 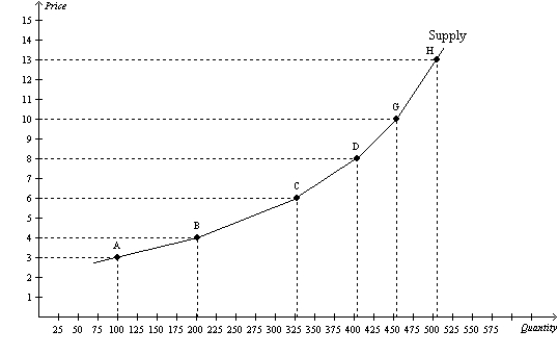 -Refer to Figure 5-15. Using the midpoint method, what is the price elasticity of supply between points C and D?
(Multiple Choice)
4.8/5  (34)
(34)
On a certain supply curve, one point is quantity supplied = 200, price = $2.00) and another point is quantity supplied= 250, price = $2.50). Using the midpoint method, the price elasticity of supply is about
(Multiple Choice)
4.8/5 (40)
When the price of chai tea lattés is $5, Maxine buys 20 per month. When the price is $4, she buys 30 per month. Maxine's demand for chai tea lattés is
(Multiple Choice)
4.7/5 (32)
On a certain supply curve, one point is quantity supplied = 200, price = $4.00) and another point is quantity supplied = 250, price = $4.50). Using the midpoint method, the price elasticity of supply is about
(Multiple Choice)
4.8/5 (33)
If the quantity supplied responds only slightly to changes in price, then
(Multiple Choice)
4.9/5 (33)
Which of the following statements about the price elasticity of demand is correct?
(Multiple Choice)
4.8/5 (41)
 -Refer to Table 5-12. Between which two quantities listed is demand most elastic?
(Short Answer)
4.8/5 (31)
Scenario 5-7
Suppose the demand function for good X is given by: 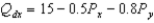 where
where  is the quantity demanded of good X,
  is the price of good X, and
  is the price of good Y, which is related to good X.
-Refer to Scenario 5-7. Good X and Good Y are related as
is the price of good Y, which is related to good X.
-Refer to Scenario 5-7. Good X and Good Y are related as
(Short Answer)
4.9/5 (35)
While in college, John and Bethany each buy five packages of mac-n-cheese per week. After they graduate and have full-time jobs, John buys six packages per week, but Bethany buys only two packages per week. When looking at income elasticity of demand for macncheese, John's
(Multiple Choice)
4.9/5 (29)
If the price elasticity of demand for a good is 6, then a 3 percent decrease in price results in
(Multiple Choice)
4.7/5 (31)
Price elasticity of demand along a linear, downward-sloping demand curve decreases as price falls.
(True/False)
4.7/5 (32)
Figure 5-6 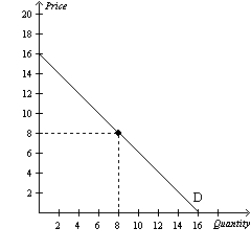 -Refer to Figure 5-6. For prices above $8, demand is price
(Multiple Choice)
4.9/5 (39)
Figure 5-9 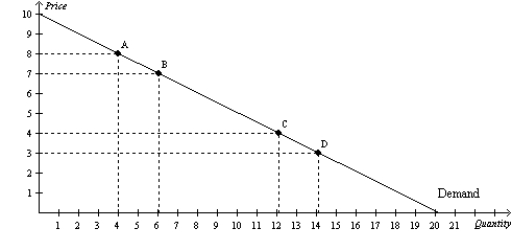 -Refer to Figure 5-9. Using the midpoint method, the price elasticity of demand between point A and point B is
(Multiple Choice)
4.9/5 (41)
The midpoint method for calculating elasticities is convenient in that it allows us to
(Multiple Choice)
4.9/5 (35)
Suppose a freeze in Florida significantly reduces the supply of oranges this year. As a result, would you expect the total revenue from the sale of orange juice to rise or fall? Explain.
(Essay)
4.8/5 (37)
Other things equal, the demand for a good tends to be more inelastic, the
(Multiple Choice)
4.8/5 (28)
When the price of candy bars is $1.00, the quantity demanded is 500 per day. When the price falls to $0.80, the quantity demanded increases to 600. Given this information and using the midpoint method, we know that the demand for candy bars is
(Multiple Choice)
4.9/5 (37)
Suppose that when the price of good X falls from $6 to $4, the quantity demanded of good Y rises from 30 units to 40 units. Using the midpoint method, the cross-price elasticity of demand is
(Multiple Choice)
4.9/5 (38)
Table 5-9
 -Refer to Table 5-9. Along which of the supply curves does quantity supplied move proportionately more than the price?
(Multiple Choice)
4.7/5 (35)
Filters
- Essay(0)
- Multiple Choice(0)
- Short Answer(0)
- True False(0)
- Matching(0)