Exam 5: Elasticity and Its Application
Exam 1: Ten Principles of Economics438 Questions
Exam 2: Thinking Like an Economist620 Questions
Exam 3: Interdependence and the Gains From Trade527 Questions
Exam 4: The Market Forces of Supply and Demand700 Questions
Exam 5: Elasticity and Its Application598 Questions
Exam 6: Supply, Demand, and Government Policies648 Questions
Exam 7: Consumers, Producers, and the Efficiency of Markets550 Questions
Exam 8: Application: The Costs of Taxation514 Questions
Exam 9: Application: International Trade496 Questions
Exam 10: Externalities522 Questions
Exam 11: Public Goods and Common Resources434 Questions
Exam 12: The Costs of Production420 Questions
Exam 13: Firms in Competitive Markets543 Questions
Exam 14: Monopoly637 Questions
Exam 15: Measuring a Nations Income522 Questions
Exam 16: Measuring the Cost of Living545 Questions
Exam 17: Production and Growth507 Questions
Exam 18: Saving, Investment, and the Financial System567 Questions
Exam 19: The Basic Tools of Finance513 Questions
Exam 20: Unemployment699 Questions
Exam 21: The Monetary System518 Questions
Exam 22: Money Growth and Inflation487 Questions
Exam 23: Aggregate Demand and Aggregate Supply563 Questions
Exam 24: The Influence of Monetary and Fiscal Policy on Aggregate Demand512 Questions
Select questions type
Figure 5-1 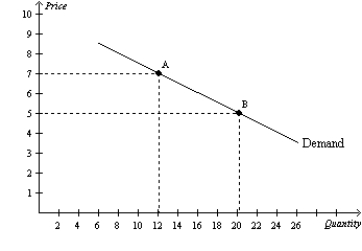 -Refer to Figure 5-1. Between point A and point B on the graph, demand is
(Multiple Choice)
4.8/5  (36)
(36)
The cross-price elasticity of demand can tell us whether goods are
(Multiple Choice)
5.0/5 (33)
Which of the following could be the price elasticity of demand for a good for which an increase in price would increase revenue?
(Multiple Choice)
4.8/5 (34)
Figure 5-4 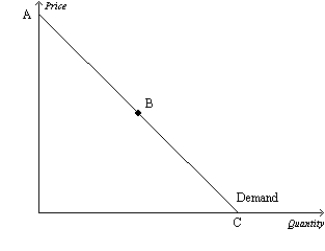 -Refer to Figure 5-4. Assume the section of the demand curve from B to C corresponds to prices between $0 and $15. Then, when the price changes between $7 and $9,
(Multiple Choice)
4.9/5 (34)
To determine whether a good is considered normal or inferior, one could examine the value of the
(Multiple Choice)
4.9/5 (33)
Table 5-4
The following table shows the demand schedule for a particular good.
 -Refer to Table 5-4. Using the midpoint method, what is the price elasticity of demand when price rises from $12 to $16?
(Multiple Choice)
4.8/5 (31)
Suppose that when the price of good X falls from $10 to $8, the quantity demanded of good Y rises from 20 units to 25 units. Using the midpoint method, the cross-price elasticity of demand is
(Multiple Choice)
5.0/5 (30)
If the income elasticity of demand for a good is -1.40, is the good a normal or inferior good?
(Short Answer)
4.9/5 (35)
If the price elasticity of demand for a good is 5, then a 10 percent increase in price results in a
(Multiple Choice)
4.9/5 (35)
Suppose that corn farmers want to increase their total revenue. Knowing that the demand for corn is inelastic, corn farmers should
(Multiple Choice)
4.8/5 (37)
Suppose that when the price of wheat is $2 per bushel, farmers can sell 10 million bushels. When the price of wheat is $3 per bushel, farmers can sell 8 million bushels. Which of the following statements is true? The demand for wheat is
(Multiple Choice)
4.8/5 (39)
Scenario 5-3
Suppose that the supply of aged cheddar cheese is inelastic, and the supply of bread is elastic. Both goods are considered to be normal goods by a majority of consumers. Suppose that a large income tax increase decreases the demand for both goods by 10%.
-Refer to Scenario 5-3. The price elasticity of supply for bread could be
(Multiple Choice)
4.9/5 (34)
Consider the following pairs of goods. For which of the two goods would you expect the demand to be more price elastic? Why?
a. water or diamonds
b. insulin or nasal decongestant spray
c. food in general or breakfast cereal
d. gasoline over the course of a week or gasoline over the course of a year
e. personal computers or IBM personal computers
(Essay)
4.9/5 (41)
Figure 5-4
-Refer to Figure 5-4. The section of the demand curve at point B represents the
(Multiple Choice)
4.9/5 (34)
Figure 5-11 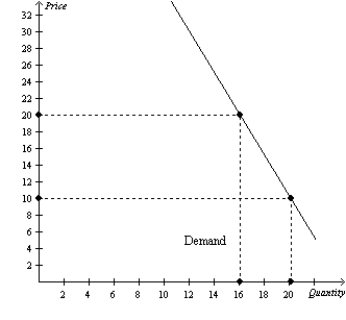 A: The Elasticity of Demand
-Refer to Figure 5-11. Suppose this demand curve is a straight, downward-sloping line all the way from the horizontal intercept to the vertical intercept. We choose two prices, P1 and P2, and the corresponding quantities demanded, Q1 and Q2, for the purpose of calculating the price elasticity of demand. Also suppose P2 > P1. In which of the following cases could we possibly find that i) demand is elastic and ii) a decrease in price from P1 to P2 causes an decrease in total revenue?
A: The Elasticity of Demand
-Refer to Figure 5-11. Suppose this demand curve is a straight, downward-sloping line all the way from the horizontal intercept to the vertical intercept. We choose two prices, P1 and P2, and the corresponding quantities demanded, Q1 and Q2, for the purpose of calculating the price elasticity of demand. Also suppose P2 > P1. In which of the following cases could we possibly find that i) demand is elastic and ii) a decrease in price from P1 to P2 causes an decrease in total revenue?
(Multiple Choice)
4.9/5 (34)
Figure 5-17 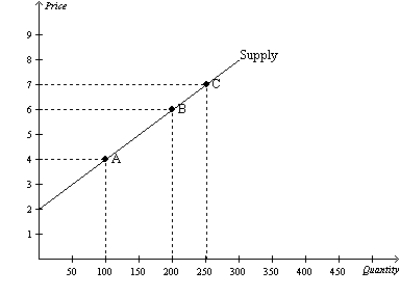 -Refer to Figure 5-17. Using the midpoint method, what is the price elasticity of supply between point A and point B?
(Multiple Choice)
4.9/5 (30)
There are very few, if any, good substitutes for motor oil. Therefore, the
(Multiple Choice)
4.9/5 (38)
For a particular good, a 2 percent increase in price causes a 12 percent decrease in quantity demanded. Which of the following statements is most likely applicable to this good?
(Multiple Choice)
4.8/5 (32)
Filters
- Essay(0)
- Multiple Choice(0)
- Short Answer(0)
- True False(0)
- Matching(0)