Exam 5: Elasticity and Its Application
Exam 1: Ten Principles of Economics438 Questions
Exam 2: Thinking Like an Economist620 Questions
Exam 3: Interdependence and the Gains From Trade527 Questions
Exam 4: The Market Forces of Supply and Demand700 Questions
Exam 5: Elasticity and Its Application598 Questions
Exam 6: Supply, Demand, and Government Policies648 Questions
Exam 7: Consumers, Producers, and the Efficiency of Markets550 Questions
Exam 8: Application: The Costs of Taxation514 Questions
Exam 9: Application: International Trade496 Questions
Exam 10: Externalities522 Questions
Exam 11: Public Goods and Common Resources434 Questions
Exam 12: The Costs of Production420 Questions
Exam 13: Firms in Competitive Markets543 Questions
Exam 14: Monopoly637 Questions
Exam 15: Measuring a Nations Income522 Questions
Exam 16: Measuring the Cost of Living545 Questions
Exam 17: Production and Growth507 Questions
Exam 18: Saving, Investment, and the Financial System567 Questions
Exam 19: The Basic Tools of Finance513 Questions
Exam 20: Unemployment699 Questions
Exam 21: The Monetary System518 Questions
Exam 22: Money Growth and Inflation487 Questions
Exam 23: Aggregate Demand and Aggregate Supply563 Questions
Exam 24: The Influence of Monetary and Fiscal Policy on Aggregate Demand512 Questions
Select questions type
Goods with close substitutes tend to have more elastic demands than do goods without close substitutes.
(True/False)
4.8/5  (30)
(30)
When supply is perfectly elastic, the value of the price elasticity of supply is
(Multiple Choice)
4.8/5 (37)
Table 5-3
Consider the following demand schedule.
 -Refer to Table 5-3. Using the midpoint method, in which range is demand most elastic?
(Multiple Choice)
4.8/5 (36)
Table 5-9
 -Refer to Table 5-9. Which of the three supply curves represents the most elastic supply?
(Multiple Choice)
4.9/5 (36)
If a 6% decrease in price for a good results in a 2% increase in quantity demanded, the price elasticity of demand is
(Multiple Choice)
4.8/5 (25)
If the price elasticity of supply is 1.5, and a price increase led to a 1.8% increase in quantity supplied, then the price increase is about
(Multiple Choice)
4.8/5 (35)
Table 5-8
 -Refer to Table 5-8. Using the midpoint method, the income elasticity of demand for good Y is
(Multiple Choice)
4.9/5 (48)
Which of the following is likely to have the most price elastic demand?
(Multiple Choice)
4.9/5 (25)
Suppose the income elasticity of demand is -0.5 for good X. This implies that a 5% decrease in income will cause the quantity demanded of good X to
(Multiple Choice)
4.8/5 (42)
If a supply curve is horizontal, then supply is said to be perfectly elastic, and the price elasticity of supply approaches infinity.
(True/False)
4.9/5 (37)
Table 5-11
 -Refer to Table 5-11. Which scenario describes the market for oil in the short run?
(Multiple Choice)
4.9/5 (28)
Figure 5-16 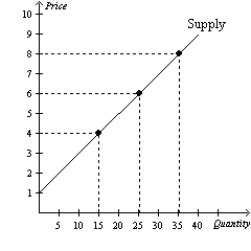 -Refer to Figure 5-16. Using the midpoint method, what is the price elasticity of supply between $4 and $6?
(Multiple Choice)
4.8/5 (32)
Figure 5-5 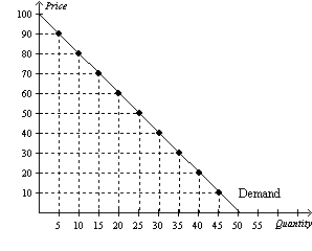 -Refer to Figure 5-5. At a price of $70 per unit, sellers' total revenue equals
(Multiple Choice)
4.8/5 (34)
Suppose an airline determines that its customers traveling for business have inelastic demand and its customers traveling for vacations have an elastic demand. If the airline's objective is to increase total revenue, it should
(Multiple Choice)
4.9/5 (29)
Skip's Sealcoating Service increased its total monthly revenue from $12,000 to $13,500 when it raised the price of driveway repairs from $600 to $750. The price elasticity of demand for Skip's Sealcoating Service is
(Multiple Choice)
4.7/5 (30)
Figure 5-3 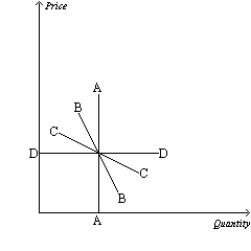 -Refer to Figure 5-3. Jenna says she would buy 10 gallons of gas per week regardless of the price. If this is true, then Jenna's demand for gas is represented by demand curve
(Multiple Choice)
4.8/5 (32)
Filters
- Essay(0)
- Multiple Choice(0)
- Short Answer(0)
- True False(0)
- Matching(0)