Exam 5: Elasticity and Its Application
Exam 1: Ten Principles of Economics438 Questions
Exam 2: Thinking Like an Economist620 Questions
Exam 3: Interdependence and the Gains From Trade527 Questions
Exam 4: The Market Forces of Supply and Demand700 Questions
Exam 5: Elasticity and Its Application598 Questions
Exam 6: Supply, Demand, and Government Policies648 Questions
Exam 7: Consumers, Producers, and the Efficiency of Markets550 Questions
Exam 8: Application: The Costs of Taxation514 Questions
Exam 9: Application: International Trade496 Questions
Exam 10: Externalities522 Questions
Exam 11: Public Goods and Common Resources434 Questions
Exam 12: The Costs of Production420 Questions
Exam 13: Firms in Competitive Markets543 Questions
Exam 14: Monopoly637 Questions
Exam 15: Measuring a Nations Income522 Questions
Exam 16: Measuring the Cost of Living545 Questions
Exam 17: Production and Growth507 Questions
Exam 18: Saving, Investment, and the Financial System567 Questions
Exam 19: The Basic Tools of Finance513 Questions
Exam 20: Unemployment699 Questions
Exam 21: The Monetary System518 Questions
Exam 22: Money Growth and Inflation487 Questions
Exam 23: Aggregate Demand and Aggregate Supply563 Questions
Exam 24: The Influence of Monetary and Fiscal Policy on Aggregate Demand512 Questions
Select questions type
Cross-price elasticity is used to determine whether goods are inferior or normal goods.
(True/False)
4.8/5  (26)
(26)
If a t-shirt manufacturer supplies 1,000 t-shirts per week when the price of t-shirts is $10 and supplies 1,200 t-shirts per week when the price of t-shirts is $12, the price elasticity of supply is 2.
(True/False)
4.8/5 (34)
Figure 5-11 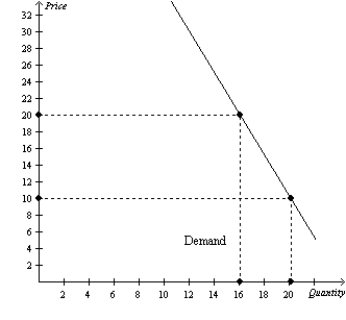 A: The Elasticity of Demand
-Refer to Figure 5-11. If price increases from $10 to $20, total revenue will
A: The Elasticity of Demand
-Refer to Figure 5-11. If price increases from $10 to $20, total revenue will
(Multiple Choice)
4.8/5 (38)
Last month, sellers of good Y took in $100 in total revenue on sales of 50 units of good Y. This month sellers of good Y raised their price and took in $120 in total revenue on sales of 40 units of good Y. At the same time, the price of good X stayed the same, but sales of good X increased from 20 units to 40 units. We can conclude that goods X and Y are
(Multiple Choice)
4.9/5 (29)
What is the price elasticity of demand at any point on a perfectly elastic demand curve?
(Essay)
4.9/5 (32)
Table 5-11
 -Refer to Table 5-11. Which scenario describes the market for oil in the long run?
(Multiple Choice)
4.8/5 (45)
A linear, downward-sloping demand curve has a constant elasticity but a changing slope.
(True/False)
4.7/5 (31)
An advance in farm technology that results in an increased market supply is
(Multiple Choice)
4.7/5 (37)
If the price elasticity of demand for a good is 0.8, then a 12 percent increase in the quantity demanded must be the result of
(Multiple Choice)
4.8/5 (32)
If the demand for donuts is elastic, then a decrease in the price of donuts will
(Multiple Choice)
4.8/5 (39)
An advantage of using the midpoint method to calculate the price elasticity of demand is that it uses the metric system.
(True/False)
5.0/5 (28)
Suppose that two supply curves pass through the same point. One is steep, and the other is flat. Which of the following statements is correct?
(Multiple Choice)
4.9/5 (35)
Supply and demand both tend to be more elastic in the long run and more inelastic in the short run.
(True/False)
4.9/5 (35)
When studying how some event or policy affects a market, elasticity provides information on the
(Multiple Choice)
4.8/5 (28)
Total revenue will be at its largest value on a linear demand curve at the
(Multiple Choice)
4.9/5 (28)
Suppose that good X is a luxury and that good Y is a necessity. Which good would you expect to have more price elastic demand?
(Short Answer)
4.8/5 (26)
When we move upward and to the left along a linear, downward-sloping demand curve, price elasticity of demand
(Multiple Choice)
4.9/5 (26)
Figure 5-4 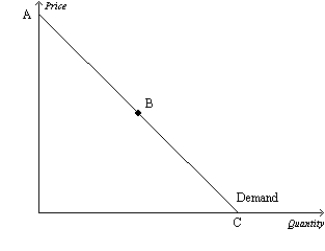 -Refer to Figure 5-4. Assume, for the good in question, two specific points on the demand curve are Q = 2,000, P= $15) and Q = 2,400, P = $12). Then which of the following scenarios is possible?
(Multiple Choice)
4.9/5 (31)
Figure 5-4
-Refer to Figure 5-4. If the price decreases in the region of the demand curve between points A and B, we can expect total revenue to
(Multiple Choice)
4.8/5 (32)
Filters
- Essay(0)
- Multiple Choice(0)
- Short Answer(0)
- True False(0)
- Matching(0)