Exam 24: The Influence of Monetary and Fiscal Policy on Aggregate Demand
Exam 1: Ten Principles of Economics438 Questions
Exam 2: Thinking Like an Economist620 Questions
Exam 3: Interdependence and the Gains From Trade527 Questions
Exam 4: The Market Forces of Supply and Demand700 Questions
Exam 5: Elasticity and Its Application598 Questions
Exam 6: Supply, Demand, and Government Policies648 Questions
Exam 7: Consumers, Producers, and the Efficiency of Markets550 Questions
Exam 8: Application: The Costs of Taxation514 Questions
Exam 9: Application: International Trade496 Questions
Exam 10: Externalities522 Questions
Exam 11: Public Goods and Common Resources434 Questions
Exam 12: The Costs of Production420 Questions
Exam 13: Firms in Competitive Markets543 Questions
Exam 14: Monopoly637 Questions
Exam 15: Measuring a Nations Income522 Questions
Exam 16: Measuring the Cost of Living545 Questions
Exam 17: Production and Growth507 Questions
Exam 18: Saving, Investment, and the Financial System567 Questions
Exam 19: The Basic Tools of Finance513 Questions
Exam 20: Unemployment699 Questions
Exam 21: The Monetary System518 Questions
Exam 22: Money Growth and Inflation487 Questions
Exam 23: Aggregate Demand and Aggregate Supply563 Questions
Exam 24: The Influence of Monetary and Fiscal Policy on Aggregate Demand512 Questions
Select questions type
An increase in the money supply shifts the aggregate-supply curve to the right.
(True/False)
4.7/5  (28)
(28)
A reduction in U.S net exports would shift U.S. aggregate demand
(Multiple Choice)
4.8/5 (37)
Explain the logic according to liquidity preference theory by which an increase in the money supply changes the aggregate demand curve.
(Essay)
4.9/5 (40)
Sometimes during wars, government expenditures are larger than normal. To reduce the effects this spending creates on interest rates,
(Multiple Choice)
4.9/5 (42)
Figure 34-10 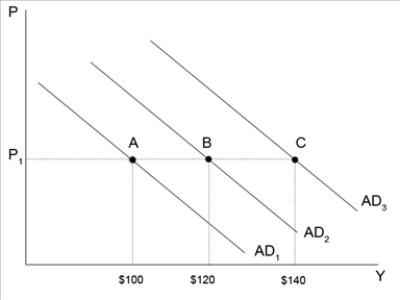 -Refer to Figure 34-10. Suppose the multiplier is 2 and there is no crowding-out, but there is an accelerator effect. If the economy is currently at point A, then an increase in government purchases of $10 will likely increase aggregate demand to point where output is $ .
(Short Answer)
4.7/5 (45)
In which of the following cases would the quantity of money demanded be smallest?
(Multiple Choice)
4.8/5 (37)
Figure 34-2. On the left-hand graph, MS represents the supply of money and MD represents the demand for money; on the right-hand graph, AD represents aggregate demand. The usual quantities are measured along the axes of both graphs.
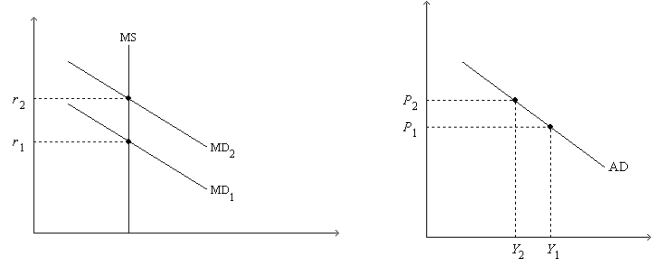 -Refer to Figure 34-2. Assume the money market is always in equilibrium. Under the assumptions of the model,
(Multiple Choice)
4.9/5 (33)
Figure 34-4. On the figure, MS represents money supply and MD represents money demand. 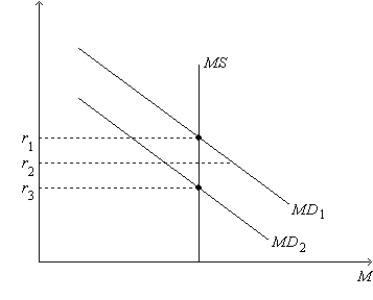 -Refer to Figure 34-4. Suppose the current equilibrium interest rate is r1. Which of the following events would cause the equilibrium interest rate to increase?
(Multiple Choice)
4.9/5 (30)
Figure 34-3 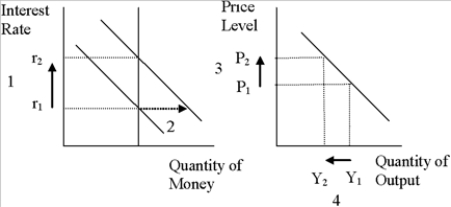 -Refer to Figure 34-3. Which of the following sequences numbered arrows) shows the logic of the interest-rate effect?
(Multiple Choice)
4.9/5 (38)
Suppose that the government spends more on a missile defense program. What does this do to aggregate demand? How is your answer affected by the presence of the multiplier, crowding-out, taxes, and investment-accelerator effects?
(Essay)
4.7/5 (35)
During a recession unemployment benefits rise. This rise in benefits makes aggregate demand higher than otherwise.
(True/False)
4.8/5 (31)
What is the value of the multiplier if the marginal propensity to consume is 0.5?
(Short Answer)
4.9/5 (27)
Assume there is a multiplier effect, some crowding out, and no accelerator effect. An increase in government expenditures changes aggregate demand more,
(Multiple Choice)
4.8/5 (34)
Suppose there is an increase in government spending. To stabilize output, the Federal Reserve would
(Multiple Choice)
4.7/5 (37)
During periods of expansion, automatic stabilizers cause government expenditures
(Multiple Choice)
4.8/5 (38)
If businesses and consumers become pessimistic, the Federal Reserve can attempt to reduce the impact on the price level and real GDP by
(Multiple Choice)
4.9/5 (39)
Figure 34-6. On the left-hand graph, MS represents the supply of money and MD represents the demand for money; on the right-hand graph, AD represents aggregate demand. The usual quantities are measured along the axes of both graphs.
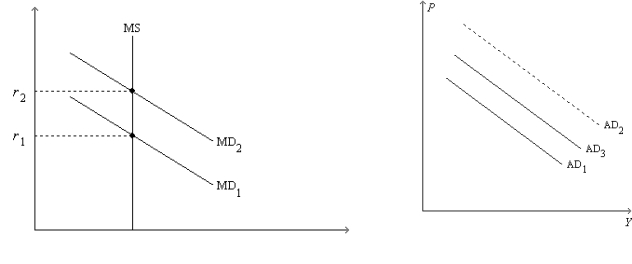 -Refer to Figure 34-6. Suppose the multiplier is 5 and the government increases its purchases by $15 billion. Also, suppose the AD curve would shift from AD1 to AD2 if there were no crowding out; the AD curve actually shifts from AD1 to AD3 with crowding out. Also, suppose the horizontal distance between the curves AD1 and AD3 is $55 billion. The extent of crowding out, for any particular level of the price level, is
(Multiple Choice)
4.8/5 (32)
Filters
- Essay(0)
- Multiple Choice(0)
- Short Answer(0)
- True False(0)
- Matching(0)