Exam 24: The Influence of Monetary and Fiscal Policy on Aggregate Demand
Exam 1: Ten Principles of Economics438 Questions
Exam 2: Thinking Like an Economist620 Questions
Exam 3: Interdependence and the Gains From Trade527 Questions
Exam 4: The Market Forces of Supply and Demand700 Questions
Exam 5: Elasticity and Its Application598 Questions
Exam 6: Supply, Demand, and Government Policies648 Questions
Exam 7: Consumers, Producers, and the Efficiency of Markets550 Questions
Exam 8: Application: The Costs of Taxation514 Questions
Exam 9: Application: International Trade496 Questions
Exam 10: Externalities522 Questions
Exam 11: Public Goods and Common Resources434 Questions
Exam 12: The Costs of Production420 Questions
Exam 13: Firms in Competitive Markets543 Questions
Exam 14: Monopoly637 Questions
Exam 15: Measuring a Nations Income522 Questions
Exam 16: Measuring the Cost of Living545 Questions
Exam 17: Production and Growth507 Questions
Exam 18: Saving, Investment, and the Financial System567 Questions
Exam 19: The Basic Tools of Finance513 Questions
Exam 20: Unemployment699 Questions
Exam 21: The Monetary System518 Questions
Exam 22: Money Growth and Inflation487 Questions
Exam 23: Aggregate Demand and Aggregate Supply563 Questions
Exam 24: The Influence of Monetary and Fiscal Policy on Aggregate Demand512 Questions
Select questions type
Open-market purchases cause an) in interest rates and an) in real GDP in the short run.
(Short Answer)
4.9/5  (31)
(31)
Scenario 34-2. The following facts apply to a small, imaginary economy.
• Consumption spending is $6,720 when income is $8,000.
• Consumption spending is $7,040 when income is $8,500.
-Refer to Scenario 34-2. In response to which of the following events could aggregate demand increase by $1,500?
(Multiple Choice)
4.7/5 (40)
The main criticism of those who doubt the ability of the government to respond in a useful way to the business cycle is that the theory by which money and government expenditures change output is flawed.
(True/False)
4.8/5 (43)
The multiplier effect states that there are additional shifts in aggregate demand from fiscal policy, because it
(Multiple Choice)
4.9/5 (38)
Figure 34-5. On the figure, MS represents money supply and MD represents money demand. 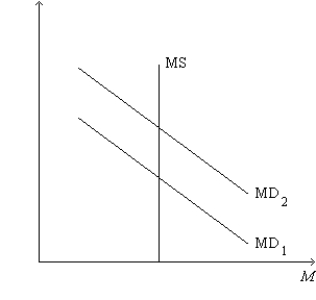 -Refer to Figure 34-5. A shift of the money-demand curve from MD1 to MD2 could be a result of
(Multiple Choice)
4.9/5 (36)
Consider the following sequence of events: price level ↑ ⇒ demand for money ↑ ⇒ equilibrium interest rate ↑
⇒ quantity of goods and services demanded ↓
Τhis sequence explains why the
(Multiple Choice)
5.0/5 (34)
According to liquidity preference theory, if the price level
(Multiple Choice)
4.7/5 (34)
It is likely that a constitutional amendment that required the government always to run a balanced budget would
(Multiple Choice)
5.0/5 (35)
In a certain economy, when income is $100, consumer spending is $60. The value of the multiplier for this economy is 4. It follows that, when income is $101, consumer spending is
(Multiple Choice)
4.9/5 (35)
Figure 34-2. On the left-hand graph, MS represents the supply of money and MD represents the demand for money; on the right-hand graph, AD represents aggregate demand. The usual quantities are measured along the axes of both graphs.
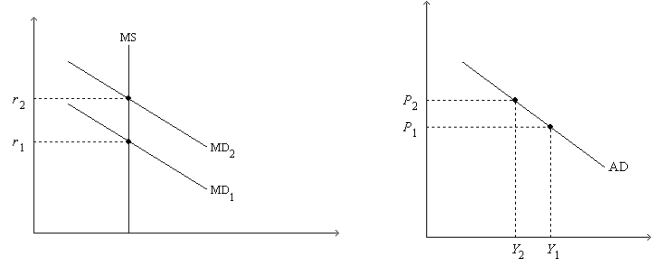 -Refer to Figure 34-2. What is measured along the horizontal axis of the left-hand graph?
(Multiple Choice)
4.9/5 (41)
Figure 34-4. On the figure, MS represents money supply and MD represents money demand. 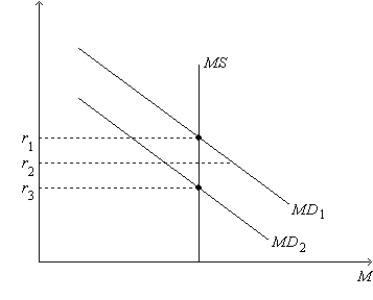 -Refer to Figure 34-4. Suppose the current equilibrium interest rate is r3. Let Y3 represent the corresponding quantity of goods and services demanded, and let P3 represent the corresponding price level. Starting from this situation, if the Federal Reserve decreases the money supply and if the price level remains at P3, then
(Multiple Choice)
4.8/5 (30)
Filters
- Essay(0)
- Multiple Choice(0)
- Short Answer(0)
- True False(0)
- Matching(0)