Exam 24: The Influence of Monetary and Fiscal Policy on Aggregate Demand
Exam 1: Ten Principles of Economics438 Questions
Exam 2: Thinking Like an Economist620 Questions
Exam 3: Interdependence and the Gains From Trade527 Questions
Exam 4: The Market Forces of Supply and Demand700 Questions
Exam 5: Elasticity and Its Application598 Questions
Exam 6: Supply, Demand, and Government Policies648 Questions
Exam 7: Consumers, Producers, and the Efficiency of Markets550 Questions
Exam 8: Application: The Costs of Taxation514 Questions
Exam 9: Application: International Trade496 Questions
Exam 10: Externalities522 Questions
Exam 11: Public Goods and Common Resources434 Questions
Exam 12: The Costs of Production420 Questions
Exam 13: Firms in Competitive Markets543 Questions
Exam 14: Monopoly637 Questions
Exam 15: Measuring a Nations Income522 Questions
Exam 16: Measuring the Cost of Living545 Questions
Exam 17: Production and Growth507 Questions
Exam 18: Saving, Investment, and the Financial System567 Questions
Exam 19: The Basic Tools of Finance513 Questions
Exam 20: Unemployment699 Questions
Exam 21: The Monetary System518 Questions
Exam 22: Money Growth and Inflation487 Questions
Exam 23: Aggregate Demand and Aggregate Supply563 Questions
Exam 24: The Influence of Monetary and Fiscal Policy on Aggregate Demand512 Questions
Select questions type
A significant example of a temporary tax cut was the one announced in 1992 by President George H. W. Bush. The effect of that tax cut on consumer spending and aggregate demand was
(Multiple Choice)
4.7/5  (37)
(37)
An aide to a U.S. Congressman computes the effect on aggregate demand of a $20 billion tax cut. The actual increase in aggregate demand is less than the aide expected. Which of the following errors in the aide's computation would be consistent with an overestimation of the impact on aggregate demand?
(Multiple Choice)
4.8/5 (44)
According to the Theory of Liquidity Preference, a fall in the _____ reduces the amount of money that people wish to hold. As a result, falling interest rates stimulates investment spending and aggregate _____.
(Short Answer)
4.8/5 (50)
In the early 1960s, the Kennedy administration made considerable use of
(Multiple Choice)
4.8/5 (33)
To reduce aggregate demand, the government may reduce or increase .
(Short Answer)
4.8/5 (33)
According to a 2009 article in The Economist, the multiplier effect and crowding-out effect would exactly offset each other when the economy is
(Multiple Choice)
4.8/5 (40)
In which of the following cases would the quantity of money demanded be largest?
(Multiple Choice)
4.7/5 (35)
Figure 34-9 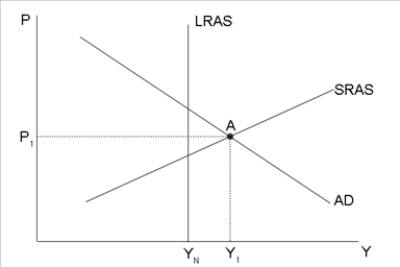 -Refer to Figure 34-9. Suppose the economy is currently at point A. To restore full employment, the Federal Reserve should
(Multiple Choice)
4.9/5 (29)
Depending on the size of the multiplier and crowding-out effects, the rightward shift in aggregate demand from a tax cut could be larger or smaller than the tax cut.
(True/False)
4.8/5 (40)
Figure 34-4. On the figure, MS represents money supply and MD represents money demand. 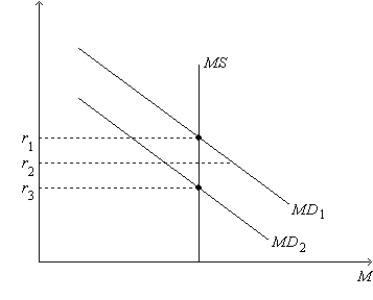 -Refer to Figure 34-4. Which of the following events could explain a shift of the money-demand curve from MD1 to MD2?
(Multiple Choice)
4.8/5 (45)
Which of the following illustrates how the investment accelerator works?
(Multiple Choice)
4.8/5 (38)
When there is an excess demand for money, households will interest-bearing bonds, causing interest rates to _____.
(Short Answer)
4.8/5 (38)
According to liquidity preference theory, if the quantity of money demanded is greater than the quantity supplied, then the interest rate will
(Multiple Choice)
4.7/5 (34)
In order to simplify the equation for the multiplier to its familiar, relatively simple form, we make use of the
(Multiple Choice)
4.9/5 (29)
According to the theory of liquidity preference, if the interest rate rises
(Multiple Choice)
4.9/5 (38)
Supply-side economists believe that a reduction in the tax rate
(Multiple Choice)
4.8/5 (34)
Figure 34-12 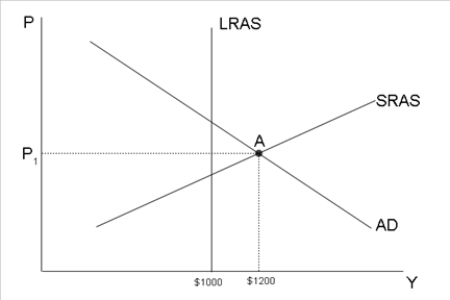 -Refer to Figure 34-12. Suppose the multiplier is 5 and the economy is currently at point A. To stabilize output at $1000, the government should _____ purchases by $_____.
(Short Answer)
4.7/5 (29)
Which of the following properly describes the interest-rate effect?
(Multiple Choice)
4.9/5 (39)
Filters
- Essay(0)
- Multiple Choice(0)
- Short Answer(0)
- True False(0)
- Matching(0)