Exam 24: The Influence of Monetary and Fiscal Policy on Aggregate Demand
Exam 1: Ten Principles of Economics438 Questions
Exam 2: Thinking Like an Economist620 Questions
Exam 3: Interdependence and the Gains From Trade527 Questions
Exam 4: The Market Forces of Supply and Demand700 Questions
Exam 5: Elasticity and Its Application598 Questions
Exam 6: Supply, Demand, and Government Policies648 Questions
Exam 7: Consumers, Producers, and the Efficiency of Markets550 Questions
Exam 8: Application: The Costs of Taxation514 Questions
Exam 9: Application: International Trade496 Questions
Exam 10: Externalities522 Questions
Exam 11: Public Goods and Common Resources434 Questions
Exam 12: The Costs of Production420 Questions
Exam 13: Firms in Competitive Markets543 Questions
Exam 14: Monopoly637 Questions
Exam 15: Measuring a Nations Income522 Questions
Exam 16: Measuring the Cost of Living545 Questions
Exam 17: Production and Growth507 Questions
Exam 18: Saving, Investment, and the Financial System567 Questions
Exam 19: The Basic Tools of Finance513 Questions
Exam 20: Unemployment699 Questions
Exam 21: The Monetary System518 Questions
Exam 22: Money Growth and Inflation487 Questions
Exam 23: Aggregate Demand and Aggregate Supply563 Questions
Exam 24: The Influence of Monetary and Fiscal Policy on Aggregate Demand512 Questions
Select questions type
When the interest rate decreases, the opportunity cost of holding money
(Multiple Choice)
4.9/5  (46)
(46)
If a $1,000 increase in income leads to an $800 increase in consumption expenditures, then the marginal propensity to consume is
(Multiple Choice)
4.9/5 (41)
According to liquidity preference theory, if the price level decreases, then
(Multiple Choice)
4.8/5 (31)
Scenario 34-1. Take the following information as given for a small, imaginary economy:
• When income is $10,000, consumption spending is $6,500.
• When income is $11,000, consumption spending is $7,250.
-Refer to Scenario 34-1. The marginal propensity to consume for this economy is
(Multiple Choice)
4.7/5 (35)
An increase in government spending shifts aggregate demand
(Multiple Choice)
4.7/5 (34)
Which of the following events would shift money demand to the left?
(Multiple Choice)
4.9/5 (40)
For the U.S. economy, the most important reason for the downward slope of the aggregate-demand curve is the interest-rate effect.
(True/False)
4.8/5 (36)
According to liquidity preference theory, equilibrium in the money market is achieved by adjustments in
(Multiple Choice)
4.8/5 (32)
In a certain economy, when income is $500, consumer spending is $375. The value of the multiplier for this economy is 5. It follows that, when income is $510, consumer spending is
(Multiple Choice)
4.9/5 (40)
Permanent tax cuts have a larger impact on consumption spending than temporary ones.
(True/False)
4.8/5 (33)
Figure 34-6. On the left-hand graph, MS represents the supply of money and MD represents the demand for money; on the right-hand graph, AD represents aggregate demand. The usual quantities are measured along the axes of both graphs.
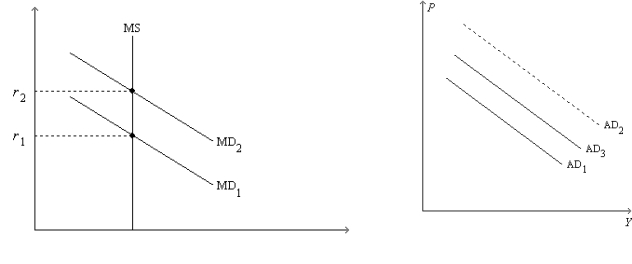 -Refer to Figure 34-6. Suppose the graphs are drawn to show the effects of an increase in government purchases. If it were not for the increase in r from r1 to r2, then
(Multiple Choice)
4.8/5 (31)
Both the multiplier effect and the investment accelerator tend to make the aggregate-demand curve shift further than it does due to an initial increase in government expenditures.
(True/False)
4.8/5 (40)
A significant lag for monetary policy is the time it takes to for a change in the money supply to change the economy. A significant lag for fiscal policy is the time it takes to pass legislation authorizing it.
(True/False)
4.9/5 (42)
Assume the MPC is 0.8. Assuming only the multiplier effect matters, a decrease in government purchases of $100 billion will shift the aggregate demand curve to the
(Multiple Choice)
4.9/5 (34)
Filters
- Essay(0)
- Multiple Choice(0)
- Short Answer(0)
- True False(0)
- Matching(0)