Exam 6: The Beast of Bias
Exam 1: Why Is My Evil Lecturer Forcing Me to Learn Statistics26 Questions
Exam 2: The Spine of Statistics29 Questions
Exam 3: The Phoenix of Statistics16 Questions
Exam 4: The IBM Spss Statistics Environment27 Questions
Exam 5: Exploring Data With Graphs23 Questions
Exam 6: The Beast of Bias32 Questions
Exam 7: Non-Parametric Models21 Questions
Exam 8: Correlation19 Questions
Exam 9: Regression33 Questions
Exam 10: Comparing Two Means20 Questions
Exam 11: Moderation, Mediation and More Regression21 Questions
Exam 12: GlM 1: Comparing Several Independent Means28 Questions
Exam 13: GlM 2: Comparing Means Adjusted for Other Predictors Analysis of Covariance20 Questions
Exam 14: GlM 3: Factorial Designs30 Questions
Exam 15: GlM 4: Repeated-Measures Designs31 Questions
Exam 16: GlM 5: Mixed Designs19 Questions
Exam 17: Multivariate Analysis of Variance Manova20 Questions
Exam 18: Exploratory Factor Analysis19 Questions
Exam 19: Categorical Outcomes: Chi-Square and Loglinear Analysis19 Questions
Exam 20: Categorical Outcomes: Logistic Regression20 Questions
Exam 21: Multilevel Linear Models20 Questions
Select questions type
We predict an outcome variable from some kind of model. That model is described by one or more _______ variables and ________ that tell us something about the relationship between the predictor and outcome variable.
(Multiple Choice)
4.9/5  (42)
(42)
When we talk about the assumption of normality, what do we mean?
(Multiple Choice)
4.9/5 (34)
In a small data sample (N = 20), what can we say about a z-score of 2.37?
(Multiple Choice)
4.8/5 (29)
A _____ is a numerical characteristic of a sample and a _____ is a numerical characteristic of a population.
(Multiple Choice)
4.8/5 (41)
A researcher investigating 'Pygmalion in the classroom' measured teachers' perceptions of male and female students' mathematical abilities. She wanted to test whether teachers perceived males as being better at maths by comparing teachers' mean ratings of 97 male and female students. Based on the output, what action should the researcher take before testing whether the mean teacher perceptions are different for male and female students? 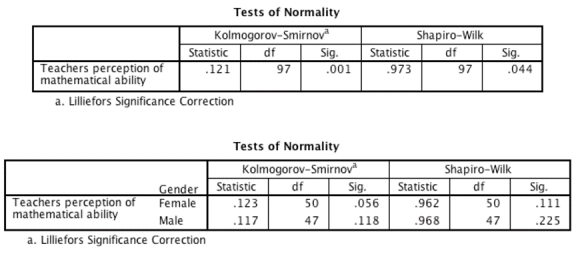
(Multiple Choice)
4.8/5 (32)
To get a sample of a certain size, scores are taken one-by-one from the observed data and each time replaced. The parameter of interest (e.g., the mean or b in regression) is computed within the sample. This process is repeated numerous times. The resulting parameter estimates are used to compute a confidence interval. The process I am describing is:
(Multiple Choice)
4.9/5 (29)
Which of the following is not an assumption of the general linear model?
(Multiple Choice)
4.9/5 (32)
What does the graph below indicate about the normality of our data? 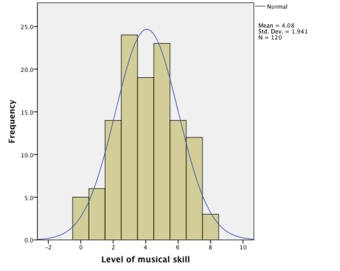
(Multiple Choice)
4.9/5 (32)
What does the graph below indicate about the normality of our data? 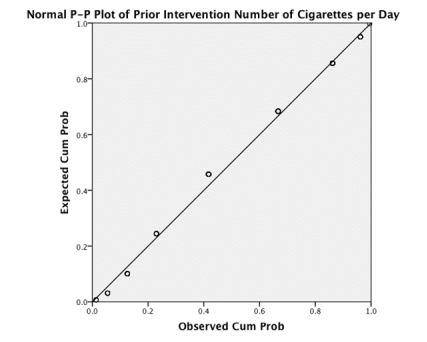
(Multiple Choice)
4.8/5 (38)
Looking at the table below, which of the following statements is correct? 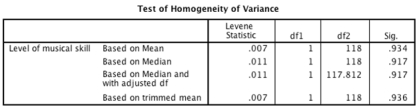
(Multiple Choice)
4.9/5 (38)
Filters
- Essay(0)
- Multiple Choice(0)
- Short Answer(0)
- True False(0)
- Matching(0)