Exam 18: Understanding Correlation Coefficients in Statistical Analysis
Exam 1: Introduction to Statistics80 Questions
Exam 2: Summarizing Data: Frequency Distributions in80 Questions
Exam 3: Summarizing Data: Central Tendency80 Questions
Exam 4: Summarizing Data: Variability80 Questions
Exam 5: Probability, Normal Distributions, and Z Scores80 Questions
Exam 6: Characteristics of the Sample Mean79 Questions
Exam 7: Hypothesis Testing: Significance, Effect Size, and Power79 Questions
Exam 8: Testing Means: One-Sample T Test With Confidence Intervals80 Questions
Exam 9: Testing Means: Two- Independent-Sample T Test With Confidence Intervals76 Questions
Exam 10: Testing Means: Related-Samples T Test With Confidence Intervals79 Questions
Exam 11: One-Way Analysis of Variance: Between- Subjects and Within- Subjects Repeated- Measures Designs60 Questions
Exam 12: Two-Way Analysis of Variance: Between-Subjects Factorial Design80 Questions
Exam 13: Correlation and Linear Regression80 Questions
Exam 14: Chi-Square Tests: Goodness of Fit and the Test for Independence78 Questions
Exam 15: Nonparametric Tests for Ordinal Data: Understanding and Interpretation59 Questions
Exam 16: Chi-Square Tests: Goodness-of-Fit and Independence80 Questions
Exam 17: Understanding Regression Analysis80 Questions
Exam 18: Understanding Correlation Coefficients in Statistical Analysis80 Questions
Select questions type
The closer that data points fall to the regression line,the more closely two factors are related.
(True/False)
4.9/5  (28)
(28)
An unanticipated variable not accounted for in a research study that could be causing or associated with observed changes in one or more measured variables is called
(Multiple Choice)
4.7/5 (36)
Suppose a correlation is computed in each of two samples.If the value of  is the same in each sample,and
  is larger in Sample 1,then in which sample will the value of the correlation coefficient be larger?
(Multiple Choice)
4.7/5 (39)
Which of the following would not be reported for a correlation?
(Multiple Choice)
5.0/5 (40)
The denominator of the correlation coefficient measures the extent to which two variables
(Multiple Choice)
4.9/5 (30)
The appropriate correlation coefficient for measuring for the direction and strength of the linear relationship between two dichotomous variables is
(Multiple Choice)
4.7/5 (33)
The formula for the point-biserial correlation coefficient was derived from the formula for the Pearson correlation coefficient.
(True/False)
4.8/5 (38)
The correlation coefficient ranges from -1.0 to +1.0,with values closer to ±1.0 indicating
(Multiple Choice)
4.9/5 (30)
A researcher computes the following phi correlation coefficient:  = 0.42.If the sample size was 20,then what is the decision for this correlation test?
(Multiple Choice)
4.9/5 (44)
Which of the following is the assumption that the best way to describe the pattern of data is using a straight line?
(Multiple Choice)
4.9/5 (34)
A researcher measures the following correlation between cost of produce and number of units sold.Which description best explains the relationship between these two factors? 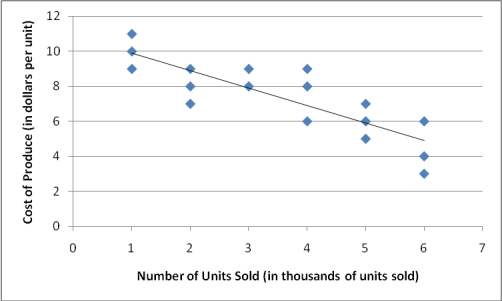
(Multiple Choice)
4.9/5 (37)
A researcher observes a correlation of values from 2 to 10 points and draws conclusions about the full range of values in the population from 0 to 21 points.Which limitation for correctly interpreting a correlation coefficient did the researcher violate?
(Multiple Choice)
4.9/5 (35)
Which of the following is the assumption that there is an equal variance of data points dispersed along the regression line?
(Multiple Choice)
4.8/5 (40)
We convert r to a chi-square statistic for which of the following correlation tests?
(Multiple Choice)
4.7/5 (30)
The phi correlation coefficient is used to measure the correlation between two ordinal variables.
(True/False)
4.9/5 (31)
A positive correlation is always stronger than a negative correlation.
(True/False)
4.7/5 (35)
A researcher determines that  = 3.76 to test for significance for a phi correlation coefficient.What was the decision for this phi correlation test?
(Multiple Choice)
4.9/5 (36)
When we compute many correlations in a single study,we report each correlation coefficient in a table called a correlation matrix.
(True/False)
4.7/5 (33)
Filters
- Essay(0)
- Multiple Choice(0)
- Short Answer(0)
- True False(0)
- Matching(0)