Exam 21: The Theory of Consumer Choice
Exam 1: Ten Principles of Economics439 Questions
Exam 2: Thinking Like an Economist617 Questions
Exam 3: Interdependence and the Gains From Trade527 Questions
Exam 4: The Market Forces of Supply and Demand697 Questions
Exam 5: Elasticity and Its Application594 Questions
Exam 6: Supply, Demand, and Government Policies645 Questions
Exam 7: Consumers, Producers, and the Efficiency of Markets549 Questions
Exam 8: Application: the Costs of Taxation513 Questions
Exam 9: Application: International Trade492 Questions
Exam 10: Externalities524 Questions
Exam 11: Public Goods and Common Resources433 Questions
Exam 12: The Design of the Tax System549 Questions
Exam 13: The Costs of Production420 Questions
Exam 14: Firms in Competitive Markets543 Questions
Exam 15: Monopoly637 Questions
Exam 16: Monopolistic Competition580 Questions
Exam 17: Oligopoly488 Questions
Exam 18: The Markets for the Factors of Production564 Questions
Exam 19: Earnings and Discrimination490 Questions
Exam 20: Income Inequality and Poverty455 Questions
Exam 21: The Theory of Consumer Choice431 Questions
Exam 22: Frontiers of Microeconomics440 Questions
Exam 23: Measuring a Nations Income520 Questions
Exam 24: Measuring the Cost of Living529 Questions
Exam 25: Production and Growth505 Questions
Exam 26: Saving, Investment, and the Financial System564 Questions
Exam 27: The Basic Tools of Finance500 Questions
Exam 28: Unemployment678 Questions
Exam 29: The Monetary System515 Questions
Exam 30: Money Growth and Inflation481 Questions
Exam 31: Open-Economy Macroeconomics: Basic Concepts522 Questions
Exam 32: A Macroeconomic Theory of the Open Economy475 Questions
Exam 33: Aggregate Demand and Aggregate Supply562 Questions
Exam 34: The Influence of Monetary and Fiscal Policy on Aggregate Demand508 Questions
Exam 35: The Short-Run Trade-Off Between Inflation and Unemployment491 Questions
Exam 36: Six Debates Over Macroeconomic Policy372 Questions
Select questions type
Figure 21-30
The graph shows two budget constraints for a consumer.  -Refer to Figure 21-30. Suppose the price of a light bulb is $3 and Budget Constraint B applies. What is the consumer's income? What is the price of a hamburger?
(Essay)
4.8/5  (28)
(28)
If a consumer purchases more of good X and good Y after her income increases, then neither good X nor good Y is an inferior good for her.
(True/False)
4.9/5 (49)
Figure 21-25
The figure pertains to a particular consumer. On the axes, X represents the quantity of good X and Y represents the quantity of good Y.  -Refer to Figure 21-25. Suppose the price of good X is $10, the price of good Y is $5, and the consumer's income is $210. Then the consumer's optimal choice is to buy
(Multiple Choice)
4.9/5 (33)
A consumer's budget constraint is drawn with the quantity of pizza measured along the horizontal axis and the price of Pepsi measured along the vertical axis. If the market is offering the consumer the trade-off of 3 pints of Pepsi for 1 pizza, then what is the slope of the consumer's budget constraint?
(Essay)
4.8/5 (37)
Figure 21-5
(a) (b) 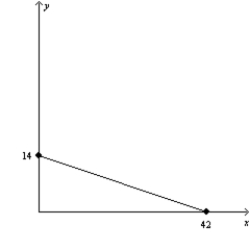
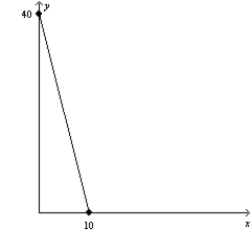 -Refer to Figure 21-5. In graph (a), what is the price of good Y relative to the price of good X (i.e., Py/Px)?
(Multiple Choice)
4.9/5 (36)
The indifference curves for left shoes and right shoes are right angles.
(True/False)
4.9/5 (34)
A consumer has preferences over consumption and leisure, both of which are normal goods. When the wage decreases, the consumer chooses to consume less leisure. For this consumer the labor supply curve will
(Multiple Choice)
4.9/5 (36)
The substitution effect from an increase in wages is evident in a
(Multiple Choice)
4.9/5 (44)
Figure 21-17  -Refer to Figure 21-17. When the price of X is $6, the price of Y is $24, and income is $48, Paul's optimal choice is point C. Then the price of Y decreases to $6. Paul's new optimal choice is point
(Multiple Choice)
4.8/5 (31)
Figure 21-32
The figure shows three indifference curves and a budget constraint for a consumer named Hannah. When young, Hannah works and earns income. When old, she is retired and earns no income.  -Refer to Figure 21-32. If Hannah chose to spend $30,000 on consumption when young, then how much could she spend on consumption when old?
(Essay)
4.8/5 (32)
Gerald spends his weekly income on gin and cocktail olives. The price of gin has risen from $7 to $9 per bottle, the price of cocktail olives has fallen from $6 to $5 per jar, and Gerald's income has stayed fixed at $46 per week. Since the price changes, Gerald has been buying 4 bottles of gin and 2 jars of cocktail olives per week. At the original prices, 4 bottles of gin and 2 jars of cocktail olives would have
(Multiple Choice)
4.8/5 (35)
The change in consumption that results when a price change moves the consumer along a given indifference curve to a point illustrating the new marginal rate of substitution is called the
(Multiple Choice)
4.8/5 (38)
Suppose a consumer spends her income on two goods: iTunes music downloads and books. The consumer has $100 to allocate to these two goods, the price of a downloaded song is $1, and the price of a book is $20. What is the maximum number of books the consumer can purchase?
(Multiple Choice)
4.8/5 (34)
Teresa faces prices of $6.00 for a unit of good X and $1.50 for a unit of good Y. At her optimum, Teresa is willing to give up 1 unit of good X for units of good Y.
(Short Answer)
4.7/5 (36)
Figure 21-20
The following graph illustrates a representative consumer's preferences for marshmallows and chocolate chip cookies:  -Refer to Figure 21-20. Assume that the consumer depicted the figure has an income of $50. Based on the information available in the graph, which of the following price-quantity combinations would be on her demand curve for chocolate chips if the price of marshmallows is $2.50?
(Multiple Choice)
4.8/5 (34)
When a consumer is purchasing the best combination of two goods, X and Y, subject to a budget constraint, we say that the consumer is at an optimal choice point. A graph of an optimal choice point shows that it occurs
(Multiple Choice)
4.9/5 (38)
If consumers purchase more of a good when their income rises, the good is a normal good.
(True/False)
4.9/5 (41)
Figure 21-18 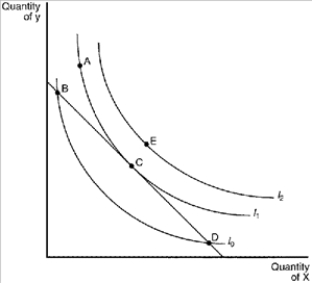 -Refer to Figure 21-18. Bundle D represents a point where
(Multiple Choice)
4.8/5 (35)
Filters
- Essay(0)
- Multiple Choice(0)
- Short Answer(0)
- True False(0)
- Matching(0)