Exam 8: Application: the Costs of Taxation
Exam 1: Ten Principles of Economics439 Questions
Exam 2: Thinking Like an Economist617 Questions
Exam 3: Interdependence and the Gains From Trade527 Questions
Exam 4: The Market Forces of Supply and Demand697 Questions
Exam 5: Elasticity and Its Application594 Questions
Exam 6: Supply, Demand, and Government Policies645 Questions
Exam 7: Consumers, Producers, and the Efficiency of Markets549 Questions
Exam 8: Application: the Costs of Taxation513 Questions
Exam 9: Application: International Trade492 Questions
Exam 10: Externalities524 Questions
Exam 11: Public Goods and Common Resources433 Questions
Exam 12: The Design of the Tax System549 Questions
Exam 13: The Costs of Production420 Questions
Exam 14: Firms in Competitive Markets543 Questions
Exam 15: Monopoly637 Questions
Exam 16: Monopolistic Competition580 Questions
Exam 17: Oligopoly488 Questions
Exam 18: The Markets for the Factors of Production564 Questions
Exam 19: Earnings and Discrimination490 Questions
Exam 20: Income Inequality and Poverty455 Questions
Exam 21: The Theory of Consumer Choice431 Questions
Exam 22: Frontiers of Microeconomics440 Questions
Exam 23: Measuring a Nations Income520 Questions
Exam 24: Measuring the Cost of Living529 Questions
Exam 25: Production and Growth505 Questions
Exam 26: Saving, Investment, and the Financial System564 Questions
Exam 27: The Basic Tools of Finance500 Questions
Exam 28: Unemployment678 Questions
Exam 29: The Monetary System515 Questions
Exam 30: Money Growth and Inflation481 Questions
Exam 31: Open-Economy Macroeconomics: Basic Concepts522 Questions
Exam 32: A Macroeconomic Theory of the Open Economy475 Questions
Exam 33: Aggregate Demand and Aggregate Supply562 Questions
Exam 34: The Influence of Monetary and Fiscal Policy on Aggregate Demand508 Questions
Exam 35: The Short-Run Trade-Off Between Inflation and Unemployment491 Questions
Exam 36: Six Debates Over Macroeconomic Policy372 Questions
Select questions type
Figure 8-6
The vertical distance between points A and B represents a tax in the market.  -Refer to Figure 8-6. When the tax is imposed in this market, producer surplus is
Free
(Multiple Choice)
4.8/5  (35)
(35)
Correct Answer: Verified
B
Figure 8-15  -Refer to Figure 8-15. Panel (a) and Panel (b) each illustrate a $4 tax placed on a market. In comparison to Panel (b), Panel (a) illustrates which of the following statements?
Free
(Multiple Choice)
4.8/5 (41)
Correct Answer:Verified
B
Scenario 8-2
Roland mows Karla's lawn for $25. Roland's opportunity cost of mowing Karla's lawn is $20, and Karla's willingness to pay Roland to mow her lawn is $28.
-Refer to Scenario 8-2. Assume Roland is required to pay a tax of $3 each time he mows a lawn. Which of the following results is most likely?
Free
(Multiple Choice)
4.8/5 (32)
Correct Answer:Verified
D
Figure 8-5
Suppose that the government imposes a tax of P3 - P1.  -Refer to Figure 8-5. Producer surplus before the tax was levied is represented by area
(Multiple Choice)
4.8/5 (32)
Figure 8-5
Suppose that the government imposes a tax of P3 - P1.
-Refer to Figure 8-5. The tax causes a reduction in consumer surplus that is represented by area
(Multiple Choice)
4.7/5 (35)
Scenario 8-3
Suppose the market demand and market supply curves are given by the equations:  -Refer to Scenario 8-3. Suppose that a tax of T is placed on buyers so that the demand curve becomes:
  If T = 40, how many units will be bought and sold after the tax is imposed?
(Essay)
4.7/5 (43)
Tax revenue equals the size of the tax multiplied by the quantity sold in the market after the tax is levied.
(True/False)
4.8/5 (35)
To measure the gains and losses from a tax on a good, economists use the tools of
(Multiple Choice)
4.9/5 (43)
Figure 8-11  -Refer to Figure 8-11. The deadweight loss of the tax is represented by the
(Multiple Choice)
4.9/5 (41)
Figure 8-18  -Refer to Figure 8-18. Suppose the government imposes a $1 tax in each of the four markets represented by supply curves S1, S2, S3, and S4. The deadweight will be the smallest in the market represented by
(Multiple Choice)
4.8/5 (30)
As the size of a tax increases, the government's tax revenue rises, then falls.
(True/False)
4.8/5 (41)
Figure 8-2
The vertical distance between points A and B represents a tax in the market.  -Refer to Figure 8-2. Producer surplus without the tax is
(Multiple Choice)
4.9/5 (36)
Figure 8-25  -Refer to Figure 8-25. Suppose the government places a $4 tax per unit on this good. What price will sellers receive for the good after the tax is imposed?
(Essay)
4.8/5 (34)
Figure 8-6
The vertical distance between points A and B represents a tax in the market.
-Refer to Figure 8-6. When the tax is imposed in this market, sellers effectively pay what amount of the $10 tax?
(Multiple Choice)
4.8/5 (39)
Figure 8-1 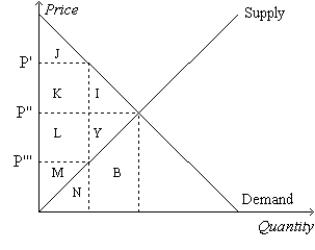 -Refer to Figure 8-1. Suppose the government imposes a tax of P' - P'''. The deadweight loss due to the tax is measured by the area
(Multiple Choice)
4.8/5 (44)
Figure 8-22  -Refer to Figure 8-22. Suppose the government changed the per-unit tax on this good from $3.00 to $1.50. Compared to the original tax rate, this lower tax rate would
(Multiple Choice)
4.8/5 (37)
Suppose that policymakers are considering placing a tax on either of two markets. In Market A, the tax will have a significant effect on the price consumers pay, but it will not affect equilibrium quantity very much. In Market B, the same tax will have only a small effect on the price consumers pay, but it will have a large effect on the equilibrium quantity. Other factors are held constant. In which market will the tax have a larger deadweight loss?
(Multiple Choice)
4.8/5 (38)
Figure 8-3
The vertical distance between points A and C represents a tax in the market.  -Refer to Figure 8-3. The price that sellers effectively receive after the tax is imposed is
(Multiple Choice)
4.8/5 (39)
A tax raises the price received by sellers and lowers the price paid by buyers.
(True/False)
4.7/5 (37)
Filters
- Essay(0)
- Multiple Choice(0)
- Short Answer(0)
- True False(0)
- Matching(0)