Exam 21: The Theory of Consumer Choice
Exam 1: Ten Principles of Economics439 Questions
Exam 2: Thinking Like an Economist617 Questions
Exam 3: Interdependence and the Gains From Trade527 Questions
Exam 4: The Market Forces of Supply and Demand697 Questions
Exam 5: Elasticity and Its Application594 Questions
Exam 6: Supply, Demand, and Government Policies645 Questions
Exam 7: Consumers, Producers, and the Efficiency of Markets549 Questions
Exam 8: Application: the Costs of Taxation513 Questions
Exam 9: Application: International Trade492 Questions
Exam 10: Externalities524 Questions
Exam 11: Public Goods and Common Resources433 Questions
Exam 12: The Design of the Tax System549 Questions
Exam 13: The Costs of Production420 Questions
Exam 14: Firms in Competitive Markets543 Questions
Exam 15: Monopoly637 Questions
Exam 16: Monopolistic Competition580 Questions
Exam 17: Oligopoly488 Questions
Exam 18: The Markets for the Factors of Production564 Questions
Exam 19: Earnings and Discrimination490 Questions
Exam 20: Income Inequality and Poverty455 Questions
Exam 21: The Theory of Consumer Choice431 Questions
Exam 22: Frontiers of Microeconomics440 Questions
Exam 23: Measuring a Nations Income520 Questions
Exam 24: Measuring the Cost of Living529 Questions
Exam 25: Production and Growth505 Questions
Exam 26: Saving, Investment, and the Financial System564 Questions
Exam 27: The Basic Tools of Finance500 Questions
Exam 28: Unemployment678 Questions
Exam 29: The Monetary System515 Questions
Exam 30: Money Growth and Inflation481 Questions
Exam 31: Open-Economy Macroeconomics: Basic Concepts522 Questions
Exam 32: A Macroeconomic Theory of the Open Economy475 Questions
Exam 33: Aggregate Demand and Aggregate Supply562 Questions
Exam 34: The Influence of Monetary and Fiscal Policy on Aggregate Demand508 Questions
Exam 35: The Short-Run Trade-Off Between Inflation and Unemployment491 Questions
Exam 36: Six Debates Over Macroeconomic Policy372 Questions
Select questions type
A consumer consumes two normal goods, popcorn and Pepsi. The price of Pepsi rises. The substitution effect, by itself, suggests that the consumer will consume
Free
(Multiple Choice)
4.9/5  (40)
(40)
Correct Answer: Verified
C
If the relative price of a concert ticket is three times the price of a meal at a good restaurant, then the opportunity cost of a concert ticket can be measured by the
Free
(Multiple Choice)
4.8/5 (38)
Correct Answer:Verified
A
Suppose a consumer consumes two goods, X and Y. The slope of the budget constraint equals the
Free
(Multiple Choice)
4.9/5 (41)
Correct Answer:Verified
C
If a consumer purchases more of good A when her income falls, good A is an inferior good.
(True/False)
5.0/5 (38)
Figure 21-18 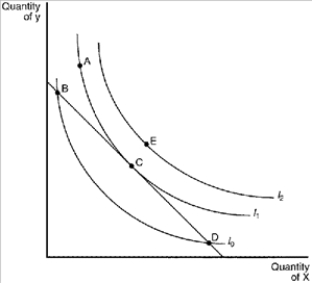 -Refer to Figure 21-18. Given the budget constraint depicted in the graph, the consumer's optimal choice will be point
(Multiple Choice)
4.8/5 (39)
A good is an inferior good if the consumer buys less of it when
(Multiple Choice)
4.7/5 (29)
If Chad's laborsupply curve is upwardsloping, then, for Chad,
(Multiple Choice)
4.8/5 (35)
A field experiment conducted by economists in the Chinese province of Hunan provided evidence that, for poor households in that province, rice is a good.
(Short Answer)
4.8/5 (45)
Figure 21-1
The downwardsloping line on the figure represents a consumer's budget constraint. 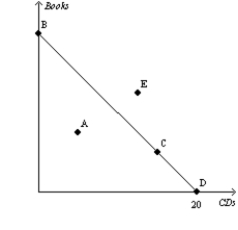 -Refer to Figure 21-1. All of the points identified on the figure represent affordable consumption options with the exception of
(Multiple Choice)
4.9/5 (36)
Suppose that you have $100 today and expect to receive $100 one year from today. Your money market account pays an annual interest rate of 25%, and you may borrow money at that interest rate. Suppose that you borrow $60 and spend $160 today. After you repay your loan one year from today, how much money will you have available for consumption one year from today?
(Multiple Choice)
4.9/5 (25)
What is significant about a point on a graph at which an indifference curve is tangent to a budget constraint?
(Essay)
4.9/5 (39)
Pepsi and pizza are normal goods. When the price of pizza falls, the substitution effect by itself will cause a
(Multiple Choice)
4.9/5 (40)
If Suzette responds to an increase in the interest rate by decreasing her saving, then, for Suzette,
(Multiple Choice)
4.9/5 (39)
Figure 21-24
The figure shows three indifference curves and a budget constraint for a certain consumer named Steve. 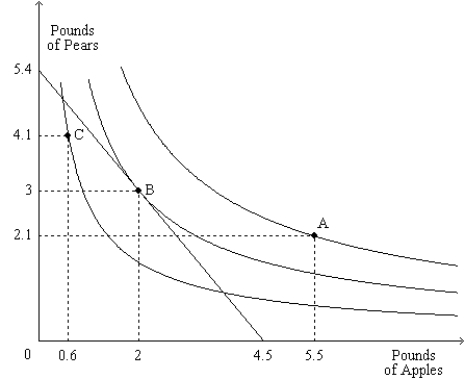 -Refer to Figure 21-24. Suppose the price of pears, the price of apples, and Steve's income remain constant, and Steve moves from point B to point C. In doing so, Steve
(Multiple Choice)
4.9/5 (41)
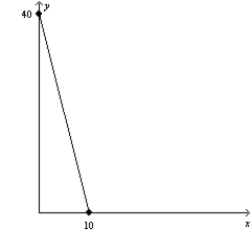
The following diagram shows two budget lines: A and B. 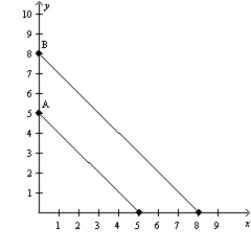 Which of the following could explain the change in the budget line from A to B?
(Multiple Choice)
4.9/5 (36)
Energy drinks and granola bars are normal goods. When the price of energy drinks decreases, the income effect causes a
(Multiple Choice)
4.7/5 (34)
Figure 21-5
(a) (b) 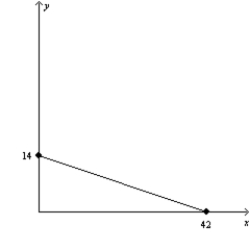
 -Refer to Figure 21-5. In graph (b), what is the price of good X relative to the price of good Y (i.e., Px/Py)?
(Multiple Choice)
4.7/5 (35)
The relationship between the marginal utility that Casey gets from eating ice cream sundaes and the number of ice cream cones he eats per week is as follows:  Casey receives 3 units of utility from the last dollar spent on each of the other goods he consumes. If ice cream sundaes cost $4 each, how many ice cream sundaes will he consume per month if he maximizes utility?
(Multiple Choice)
4.8/5 (35)
The following diagram shows two budget lines: A and B. 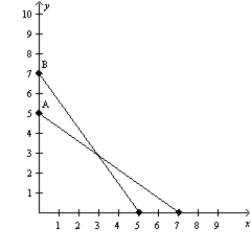 Which of the following could explain the change in the budget line from A to B?
(Multiple Choice)
4.8/5 (41)
Filters
- Essay(0)
- Multiple Choice(0)
- Short Answer(0)
- True False(0)
- Matching(0)